Download
1 / 11
110 likes | 187 Views
This study compares ion funnels and standard interfaces for peptide detection using dual ion funnel and Thermo interface. Data from ten peptides were analyzed with Xcalibur 2.0.7 to determine LODs and reproducibility. Identified analyte peaks are highlighted for visualization. Key criteria include peak widths, elution times, and peak areas.

E N D
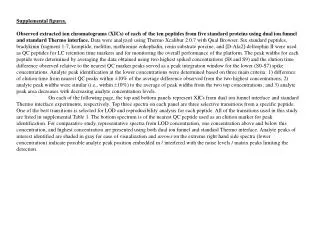
Supplemental figures. Observed extracted ion chromatograms (XICs) of each of the ten peptides from five standard proteins using dual ion funnel and standard Thermo interface. Data were analyzed using Thermo Xcalibur 2.0.7 with Qual Browser. Six standard peptides, bradykinin fragment 1-7, kemptide, melittin, methionine enkephalin, renin substrate porcine, and [D-Ala2]-deltorphin II were used as QC peptides for LC retention time markers and for monitoring the overall performance of the platform. The peak widths for each peptide were determined by averaging the data obtained using two highest spiked concentrations (S8 and S9) and the elution time difference observed relative to the nearest QC marker peaks served as a peak integration window for the lower (S0-S7) spike concentrations. Analyte peak identification at the lower concentrations were determined based on three main criteria: 1) difference of elution time from nearest QC peaks within ±10% of the average difference observed from the two highest concentrations; 2) analyte peak widths were similar (i.e., within ±10%) to the average of peak widths from the two top concentrations; and 3) analyte peak area decreases with decreasing analyte concentration levels. On each of the following page, the top and bottom panels represent XICs from dual ion funnel interface and standard Thermo interface experiments, respectively. Top three spectra on each panel are three selective transitions from a specific peptide. One of the best transitions is selected for LOD and reproducibility analysis for each peptide. All of the transitions used in this study are listed in supplemental Table 1. The bottom spectrum is of the nearest QC peptide used as an elution marker for peak identification. For comparative study, representative spectra from LOD concentration, one concentration above and below this concentration, and highest concentration are presented using both dual ion funnel and standard Thermo interface. Analyte peaks of interest identified are shaded in gray for ease of visualization and arrows on the extreme right hand side spectra (lower concentration) indicate possible analyte peak position embedded in / interfered with the noise levels / matrix peaks limiting the detection.
a) Dual ion funnel interface 40 µg/mL 400 ng/mL 40 ng/mL 80 ng/mL (LOD) b) Standard Thermo interface 80 ng/mL 40 µg/mL 4 µg/mL 400 ng/mL (LOD) A: XICs of peptide VLDALDSIK. LODs were determined for transition of m/z 487.282+ > 874.49+ . Methionine enkephalin (transition m/z 574.162+ > 397.24+) was used here as a retention time marker.
a) Dual ion funnel interface 40 µg/mL 80 ng/mL 8 ng/mL 40 ng/mL (LOD) b) Standard Thermo interface 40 ng/mL 40 µg/mL 400 ng/mL 80 ng/mL (LOD) B: XICs of peptide DFPIANGER. LODs were determined for transition of m/z 509.752+ > 378.70+ . Bradykinin fragment 1-7 (transition m/z 379.142+ > 527.31+) was used here as a retention time marker.
a) Dual ion funnel interface 40 µg/mL 400 ng/mL 40 ng/mL 80 ng/mL (LOD) b) Standard Thermo interface 80 ng/mL 40 µg/mL 4 µg/mL 400 ng/mL (LOD) C: XICs of peptide VDEDQPFPAVPK. LODs were determined for transition of m/z 671.342+ > 755.45+ . Methionine enkephalin (transition m/z 574.162+ > 397.25+) was used here as a retention time marker .
a) Dual ion funnel interface 40 µg/mL 400 ng/mL 4 µg/mL (LOD) b) Standard Thermo interface 40 µg/mL 4 µg/mL (LOD) 400 ng/mL D: XICs of peptide LWSAEIPNLYR. LODs were determined for transition of m/z 681.362+ > 662.36+ . Renin substrate porcine (transition m/z 587.343+ > 696.30+) was used here as a retention time marker.
a) Dual ion funnel interface 40 µg/mL 400 ng/mL 40 ng/mL 80 ng/mL (LOD) b) Standard Thermo interface 40 µg/mL 400 ng/mL 80 ng/mL (LOD) 40 ng/mL E: XICs of peptide LFTGHPETLEK. LODs were determined for transition of m/z 424.563+ > 506.26+ . Bradykinin fragment 1-7 (transition m/z 379.142+ > 527.31+) was used here as a retention time marker for accurate peak identification. On dual funnel interface, an interference between analyte peak of interest and a matrix peak confounded quantification of proteins at <80 ng/mL.
a) Dual ion funnel interface 40 µg/mL 4 µg/mL (LOD) 400 ng/mL b) Standard Thermo interface 40 µg/mL (LOD) 4 µg/mL 400 ng/mL F: XICs of peptide YLEFISDAIIHVLHSK. LODs were determined for transition of m/z 629.013+ > 740.42+ . Renin substrate porcine (transition m/z 587.342+ > 696.30+) was used here as a retention time marker for accurate peak identification.
a) Dual ion funnel interface 40 µg/mL (LOD) 4 µg/mL 400 ng/mL b) Standard Thermo interface 40 µg/mL (LOD) 4 µg/mL 400 ng/mL G: XICs of peptide HIATNAVLFFGR. LODs were determined for transition of m/z 673.372+ > 1095.59+ . [D-Ala-2]-Deltorphin II (transition m/z 783.192+ > 709.22+) was used here as a retention time marker.
a) Dual ion funnel interface 40 µg/mL 400 ng/mL 40 ng/mL 80 ng/mL (LOD) b) Standard Thermo interface 40 µg/mL 4 µg/mL (LOD) 400 ng/mL H: XICs of peptide GGLEPINFQTAADQAR. LODs were determined for transition of m/z 844.422+ > 666.34+ . Methionine enkephalin (transition m/z 574.162+ > 397.25+) was used here as a retention time marker .
a) Dual ion funnel interface 40 µg/mL 400 ng/mL 40 ng/mL 80 ng/mL (LOD) b) Standard Thermo interface 80 ng/mL 40 µg/mL 4 µg/mL 400 ng/mL (LOD) I: XICs of peptide EDLIAYLK. LODs were determined for transition of m/z 482.772+ > 494.30+ . [D-Ala-2]-Deltorphin II (transition m/z 783.192+ > 709.22+) was used here as a retention time marker.
a) Dual ion funnel interface 40 µg/mL 80 ng/mL 8 ng/mL 40 ng/mL (LOD) b) Standard Thermo interface 80 ng/mL 40 µg/mL 4 µg/mL 400 ng/mL (LOD) J: XICs of peptide TGQAPGFSYTDANK. LODs were determined for transition of m/z 728.842+ > 1099.51+ . Bradykinin fragment 1-7 (transition m/z 379.142+ > 614.36+) was used here as a retention time marker.