Genetic Analysis of Alzheimer's Disease Pathology with ADGC Cohort
210 likes | 301 Views
Explore preliminary GWAS results using additive mode of inheritance model. Scree plots show PC analysis. Manhattan plot highlights key SNP near APOE locus. LocusZoom plots demonstrate GWAS meta-analysis with HS-Aging phenotype. Association studies and forest plots analysis across multiple cohorts. Western blots analysis using hippocampus tissue from autopsies. Detailed extraction and immunoblot procedures for protein analysis.

Genetic Analysis of Alzheimer's Disease Pathology with ADGC Cohort
E N D
Presentation Transcript
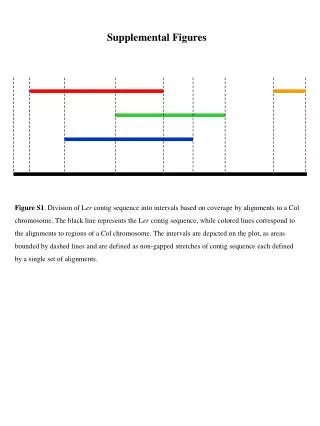
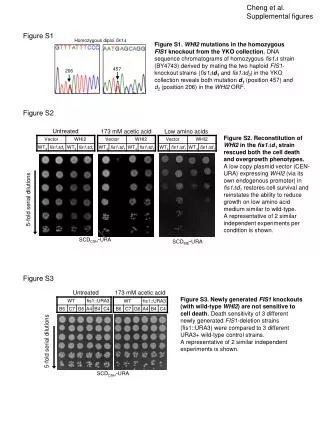
Supplemental Figures Supplemental Fig. 1 Scree plots that display the first 10 principal components (PCs) using additive mode of inheritance model in the Stage I GWAS, for the ADGC (a), ROS-MAP (b), and ACT (c) cohorts. On the y axes are Eigenvalues. Based on these plots, we adjusted for four PCs in the ADGC and ROS-MAP analyses and three PCs in the ACT analysis. Supplemental Fig. 2 Preliminary GWAS was performed using AD pathology as endophenotype, from the ADGC cohort (see Supplemental Tables 2,3). Manhattan plot showing –log10(p)-values from the GWAS that comprised 1443 AD cases and 99 controls . The only SNP found to reach genome-wide statistical significance (p<5x10⁻⁸ to correct for multiple comparisons) in this GWAS was near the APOE locus (orange arrow), which yielded p<10-12. This gives an idea of the statistical power, which requires a risk allele with a large effect size. Supplemental Fig. 3LocusZoom plot showing results of HS-Aging GWAS meta-analyzed data from Discovery datasets; y axis shows –log10(p)-values describing the results of association study with HS-Aging phenotype centered on the rs7966849 (p<2x10⁻⁷) risk allele. This SNPJ is in strong linkage disequilibrium with the SNPs (rs704178 and rs704180) that were the subject of further study. Supplemental Fig. 4LocusZoom plot showing results of HS-Aging GWAS meta-analyzed data from Discovery datasets; y axis shows –log10(p)-values describing the results of association study with HS-Aging phenotype centered on the rs8018486 (p<2x10⁻⁶) risk allele, within a CTAGE5 gene intron. This is the SNP with the lowest p-value in the GWAS outside the ABCC9 locus. Supplemental Fig. 5 Association studies were performed for each individual autopsy cohort, and then combined using meta-analyses across all six Discovery and Replication cohorts, using inverse-variance based statistic. Forest plots displaying cohort-specific and aggregated odds ratios and confidence intervals were created reflecting these meta-analyzed results. Lines represent 95% confidence intervals for the odds ratios, and the size of the square (cohort) or trapezoid (meta-analyzed group) reflects the cohort size. Shown here are the results when assuming a dominant model of inheritance. Supplemental Fig. 6 Western blots, see below
PT Nelson et al, Supplemental Figure 1 a Eigenvalue b Eigenvalue c Eigenvalue
PT Nelson et al, Supplemental Figure 2 -log10(p-value)
PT Nelson et al, Supplemental Figure 3 Stage I Cohorts GWAS
PT Nelson et al, Supplemental Figure 4 Stage I Cohorts GWAS
PT Nelson et al, Supplemental Figure 5 Forest plot with meta-analyses: Dominant model of mode of inheritance p-value
Supplemental Fig. 6: Western blots Supplemental Fig. 6 Legend: Hippocampus tissue from postmortem brain autopsies were dissected, weighed and homogenized in 5ml/g Low-salt (LS) buffer (10mM Tris, pH 7.5, 5mM EDTA, 1mM DTT, 10% Sucrose and a cocktail of protease and phosphatase inhibitors) and centrifuged at 20,000Xg for 30 minutes at 4°C. Supernatants were saved as the LS fraction. Pellets from the above sedimentation were subjected to two sequential extractions in 5ml/g Triton-X-100 (TX) buffer (LS+ 1% Triton-X-100+0.5M NaCl) and centrifugation at 20,000Xg for 30 minutes at 4°C. Supernatants from the first of these TX buffer extractions were saved as TX fraction. Pellets were homogenized in 5ml/g Sarkosyl (SARK) buffer (LS+ 1%N-Lauryl-Sarcosine+0.5M NaCl) and incubated at 22°C on a shaker for 1hr before sedimentation at 20,000Xg for 30 minutes at 22°C. Supernatants were saved as the SARK fraction. Remaining pellets were extracted in 1ml/g Urea buffer (7M Urea, 2M Thiourea, 4% CHAPS, 30mM Tris, pH – 8.5) before centrifugation at 25,000Xg for 30 minutes at 22°C. Immunoblot analysis. Equal amounts of protein were loaded to denaturing SDS Polyacrylamide gel prior to immunoblot analysis, for LS and TX fractions. The gels, after run, were washed for 10 minutes in Deionized water before transfer. After transfer onto a nitrocellulose membrane, the nonspecific epitopes were blocked with 5% Nonfat milk, for 1hr at room temp. The antibodies used are as follows: SUR2B (C-15; Fig. S6a,b): sc-5793, SUR2A (T-19; Fig. S6c,d): sc-32461, SUR2 (H-80; Fig. S6, e,f): sc-25684, all three from Santacruz Biotechnology, Inc, and anti-SUR2B, clone N323A/31 (Fig. S6 g,h) and anti-SUR2A, clone N319A/14 (Fig. S6 i,j) from EMD-Millipore. Control immunoblots using the same samples were performed using anti-PGRN/GRN (R&D Cat # AF 2420; Fig. S6 k,l), and anti-b-Actin (Rockland Code 600-401-886; Fig. S6 m,n) antibodies. The dilutions used were according to the manufacturers’ instruction. The secondary antibodies were all Alkaline Phosphatase conjugated, from Jackson Immunoresearch. The bands were visualized with the Enhanced Chemi-Luminescence kit from Thermo® . Table of cases used in immunoblots, in order, with age, HS status, rs704178 status, Braak stage
Supplemental Fig. 6a Immunoblot against Low Salt fractions with anti SUR2B (C-15) antibody Case # 1 2 3 4 5 6 7 8 9 230 150 100 80 60 50 40 30 25 20 Immunoblot against Triton-X-100 fractions with anti SUR2B (C-15) antibody Case # 1 2 3 4 5 6 7 8 9 230 150 100 80 60 50 40 30 25 20
Supplemental Fig. 6b Immunoblot against Sarkosyl fractions with anti SUR2B (C-15) antibody Case # 1 2 3 4 5 6 7 8 9 230 150 100 80 60 50 40 30 25 20 Immunoblot against Urea fractions with anti SUR2B (C-15) antibody Case # 1 2 3 4 5 6 7 8 9 230 150 100 80 60 50 40 30 25 20
Supplemental Fig. 6c Immunoblot against Low Salt fractions with anti SUR2A (T-19) antibody Case # 1 2 3 4 5 6 7 8 9 230 150 100 80 60 50 40 30 25 20 Immunoblot against Triton-X-100 fractions with anti SUR2A (T-19) antibody Case # 1 2 3 4 5 6 7 8 9 230 150 100 80 60 50 40 30 25 20
Supplemental Fig. 6d Immunoblot against Sarkosyl fractions with anti SUR2A (T-19) antibody Case # 1 2 3 4 5 6 7 8 9 230 150 100 80 60 50 40 30 25 20 Immunoblot against Urea fractions with anti SUR2A (T-19) antibody Case # 1 2 3 4 5 6 7 8 9 230 150 100 80 60 50 40 30 25 20
Supplemental Fig. 6e Immunoblot against Low Salt fractions with anti SUR2 (H-80) antibody Case # 1 2 3 4 5 6 7 8 9 230 100 80 60 50 40 30 25 20 15 Immunoblot against Triton-X-100 fractions with anti SUR2 (H-80) antibody Case # 1 2 3 4 5 6 7 8 9 230 150 100 80 60 50 40 30
Supplemental Fig. 6f Immunoblot against Sarkosyl fractions with anti SUR2 (H-80) antibody Case # 1 2 3 4 5 6 7 8 9 230 150 100 80 60 50 40 30 25 Immunoblot against Urea fractions with anti SUR2 (H-80) antibody Case # 1 2 3 4 5 6 7 8 9 230 150 100 80 60 50 40 30 25 20
Supplemental Fig. 6g Immunoblot against Low Salt fractions with anti SUR2B antibody clone N323A/31 Case # 1 2 3 4 5 6 7 8 9 230 100 80 50 40 30 25 20 15 10 Immunoblot against Triton-X-100 fractions with anti SUR2B antibody Case # 1 2 3 4 5 6 7 8 9 230 100 80 50 40 30 25 20 15 10
Supplemental Fig. 6h Immunoblot against Sarkosyl fractions with anti SUR2B antibody clone N323A/31 Case # 1 2 3 4 5 6 7 8 9 230 100 80 50 40 30 25 20 15 10 Immunoblot against Urea fractions with anti SUR2B antibody Case # 1 2 3 4 5 6 7 8 9 230 100 80 50 40 30 25 20 15 10
Supplemental Fig. 6i Immunoblot against Low Salt fractions with anti SUR2A antibody Case # 1 2 3 4 5 6 7 8 9 clone N319A/14 230 100 80 50 40 30 25 20 15 10 Immunoblot against Triton-X-100 fractions with anti SUR2A antibody Case # 1 2 3 4 5 6 7 8 9 230 100 80 50 40 30 25 20 15 10
Supplemental Fig. 6j Immunoblot against Sarkosyl fractions with anti SUR2A antibody clone N319A/14 Case # 1 2 3 4 5 6 7 8 9 230 100 80 50 40 30 25 20 15 10 Immunoblot against Urea fractions with anti SUR2A antibody Case # 1 2 3 4 5 6 7 8 9 230 100 80 50 40 30 25 20 15 10
Supplemental Fig. 6k Immunoblot against Low Salt fractions with anti GRN antibody Case # 1 2 3 4 5 6 7 8 9 230 150 100 80 60 50 40 30 25 20 Immunoblot against Triton-X-100 fractions with anti GRN antibody Case # 1 2 3 4 5 6 7 8 9 230 150 100 80 60 50 40 30 25
Supplemental Fig. 6l Immunoblot against Sarkosyl fractions with anti GRN antibody Case # 1 2 3 4 5 6 7 8 9 230 150 100 80 60 50 40 30 25 Immunoblot against Urea fractions with anti GRN antibody Case # 1 2 3 4 5 6 7 8 9 230 150 100 80 60 50 40 30 25
Supplemental Fig. 6m Immunoblot against Low Salt fractions with anti Beta actin antibody Case # 1 2 3 4 5 6 7 8 9 230 150 100 80 60 50 40 30 25 Immunoblot against Triton-X-100 fractions with anti Beta actin antibody Case # 1 2 3 4 5 6 7 8 9 230 100 80 60 50 40 30 25 20 15
Supplemental Fig. 6n Immunoblot against Sarcosyl fractions with anti Beta actin antibody Case # 1 2 3 4 5 6 7 8 9 230 100 80 60 50 40 30 25 20 15 Immunoblot against Urea fractions with anti Beta actin antibody Case # 1 2 3 4 5 6 7 8 9 230 150 100 80 60 50 40 30 25