Download
1 / 16
160 likes | 179 Views
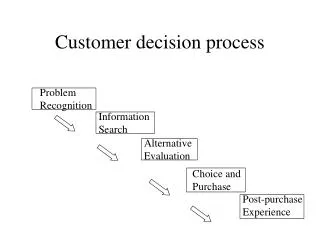
Explore FMI’s observation networks, customer processes, survey results, and quality attributes. Enhance customer satisfaction and service quality through real-time observations and feedback.

E N D
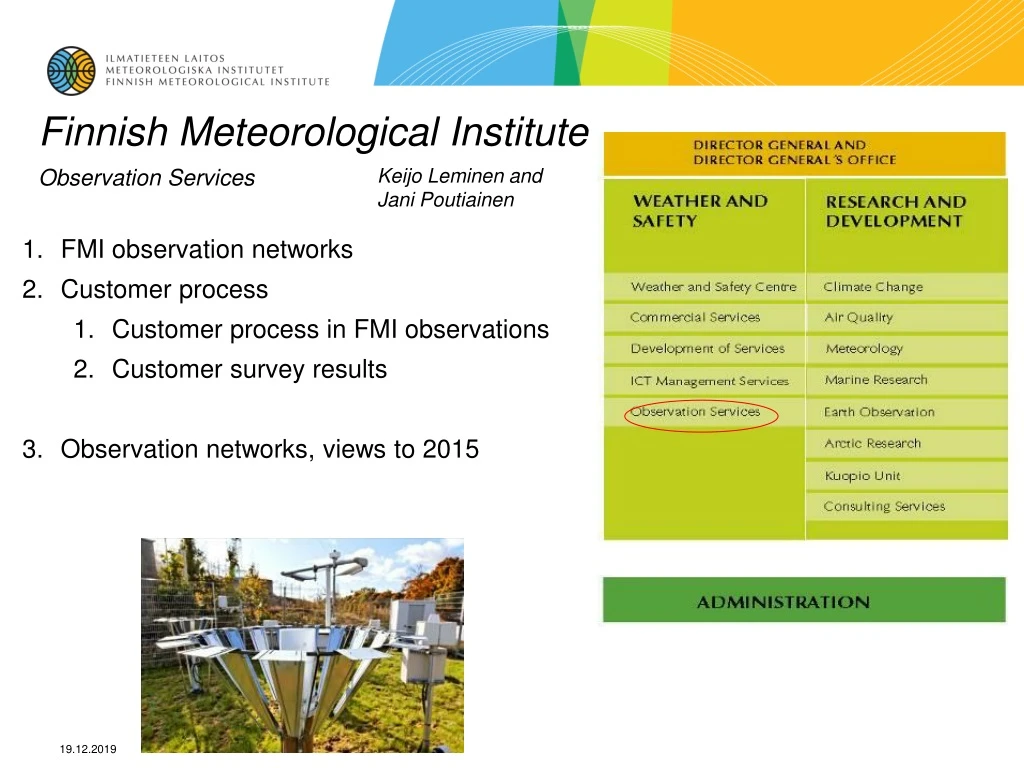
Finnish Meteorological Institute Observation Services Keijo Leminen andJani Poutiainen • FMI observation networks • Customer process • Customer process in FMI observations • Customer survey results • Observation networks, views to 2015
Manual weather station Automatic weather station Automatic and manual combined Mast (including research masts) Radar Manual precipitation station (daily) Manual precipitation station (monthly) FMI Observation networks • Almost 200 automatic weather stations • 100 manual precipitation stations • 8 weather radars • 3 radio sounding stations • 4 instrumented masts • 8 lightning detection sites • 9 weather camera stations • 15 air quality stations • 9 radioactivity stations • 12 magnetometers • 7 aurora borealis cameras • 13 sea level height measurement sites • 20 solar radiation stations More than 400 observation sites in Finland
National network – central methods of observation Surface weather station Lightning location Weather radar Radio sounding Mast observations Space weather Air quality obs
Changes in different observation networks PRECIPITATION
The amount of real time observations (10 minutes interval) 2005 2010
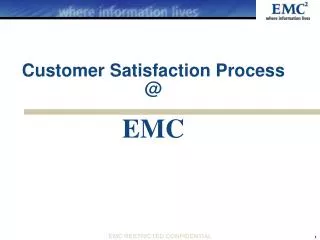
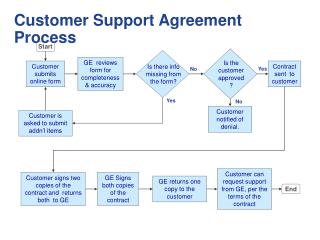
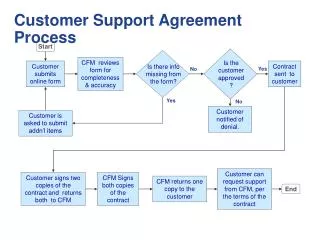
High level process of the Observation Services and customer process as a part of it Customer process
Customer process: Goals and practices • FMI Observation Service production: • Observation data services (weather, sea, air quality, magnetism), • Technical and expert services for research and consulting • The target of the customer process: • Thorough up to date understanding on customer needs and satisfaction. • Feedback loop for operations. • Identification of services which the clients value the most • Find out the relative importance of the customers (priorities). • Prepare plans to support the unit management and annual investment plans
Customer survey 2009 • Survey directed to FMI internal customer groups • Survey conducted by 9-point scale • First quantative results on service quality • Service qualitylevel definitions: • Expected service level • Perceived service level • Lowest acceptable service level
Service quality survey: Quality attributes • Radio soundings. • Air craft observations. • GPS observations (atmospheric water vapor content). • Mast observations. • Satellite observations. • Weather camera observations. • Research support observations (e.g. Sodankylä or Helsinki Testbed). • Observation equipment and methods are up-to-date. • Spatial amount (2D) of observations. • Volumetric amount (3D) of observations. • Temporal resolution of observations. • Real-timeliness of observations (delays). • Width of variable selection. • Observation accessibility (data breaks). • Easiness in using observations. • Easiness in using metadata. • Quality of observations. • Feasibility of produced observations to my purposes. • Your unit. • How often do you use some information or service provided by the Observation Services? 1=never, 2=very seldom, 3=annually, 4=semi-annually, 5=monthly, 6=weekly, 7=daily, 8=hourly, 9=more often. • How did you feel about answering to this survey? 1=very negatively (tedious, frustrating) … 9 very positively (inspiring, easy). • Free form feedback to the Observation Services. • Willingness to provide service and collaborate. • Customer is actively informed on changes about working environment, observation network and service offerings. • Customer gets information about working environment, observation network and service offerings, if asked. • Staff understands the needs of the customer. • Customer given feedback is taken into account. • Staff has time to answer to questions/needs. • Services are produced on agreed schedule. • Error situations are handled quickly. • Responsibility distinction between your unit and the Observation Services is clear. • Staff's expertise on the field of observation production. • Easiness in dealing with the Observation Services. • Quality of services as a whole. • The Observation Services' activities are cost-efficient. • Weather radar observations. • Lightning location observations. • Surface observations (basic variables: temperature, humidity, pressure, wind). • Surface observations (basic variables: rain and snow). • Surface observations (present change pressure: ground minimum temperature measurement). • Surface observations (other variables: radiation, clouds, present weather etc.). • Air quality observations (gas and small particle measurements, particle and gas sample collection, lower atmosphere radioactivity measurements etc.). • Observations on magnetism (Aurora Borealis observations, magnetic field) Survey scale: from “1” extremely unsatisfied to “9” extremely satisfied.
Service quality survey: Results Rain and snow Ground minimum temperature Radiation, clouds, present weather -quality and amount
Development needs of produced observations The greatest attention is needed for: • Three dimensional amount of observations, • “Other“ surface weather observations (like radiation, clouds, present weather), • Basic surface weather observations of rain and snow • Ground minimum temperature observations
Observation networks, views to 2015 • Automation degree nearly to 100% • Automated precipitation measurement on about 200 sites, mostly based at normal AWS stations. Manual part to minimun • Availability of reliable automatic methods of wintertime precipitation observation required • Automation of surface networks to continue, up to 250 AWS’S • New dual-polarization weather radar network data is expected to compensate precipitation information due to decreasing amount of precipitation measurements. • Lightning location network will give more accurate information with the denser network. • The increase in the amount of marine research measurement sites will be completed. • New observation technologies like wind profiler and lidar networks are to be established. • Weather cameras amount will be increased
Observation services, view to 2015 2010 2015 • Automatic Weather stations (including precipitation) 200 250 • Manual precipitation stations 100 20 • Weather radars, Doppler/Dual Pol 8/3 8/8 • Lightning location stations 8 10 • Weather Cameras 9 20 • Sea level measuring stations 13 15-18 • Wave buoys 2 4 • Wind profilers 0 2-5 • Lidars, wind measurement 0 3 • Lidars, vulcanic ash detection 0 3 • Instrumented towers 4 4 • Radiosounding stations 3 3 • Air Quality stations 15 15 • Radioactivity stations 9 9 • Magnetometers 12 12 • Auroral station (cameras) 7 7