Download
1 / 60
600 likes | 740 Views
2nd CLIM-RUN School: Building Two-way Communication: A Week of Climate Services Trieste - Italy, 02 - 06 December 2013. Seasonal to decadal up to climate change predictability (projections) Fred Kucharski Abdus Salam ICTP, Trieste, Italy,

E N D
2nd CLIM-RUN School: Building Two-way Communication: A Week of Climate Services Trieste - Italy, 02 - 06 December 2013 Seasonal to decadal up to climate change predictability (projections) Fred Kucharski Abdus Salam ICTP, Trieste, Italy, Earth System Physics Section
A general consideration (possibly trivial to most of you): In principle, why do we expect the climate to be predictable (or 'projectable') for several month or even 100-200 years ahead if weather forecasts are (more or less) reliable only 1-2 weeks ahead?
In seasonal and longer time scale predictions (projections) there will be clearly no (atmospheric) predictability of the first kind (Lorenz notation for initial condition dependent predictability). We cannot try to predict details of ‘weather’ more than a few weeks ahead. This is because the climate system is chaotic (lots of instabilities and nonlinearities, from daily to even decadal time-scales). But we may be able to predict the statistics of climate (e.g. mean, variability….), if there are either slowly varying (and predictable) components, such as El Nino SSTs in case of seasonal predictions or external forcing of the Earth System (e.g. Carbon Dioxide, Solar forcing, Volcanoes, Aerosols, ….) in case of climate change projections. Lorenz called this predictability of the second kind. This could give a hint then of shifts of the mean climate (or attractors in Lorenz‘ language) and its statistics.
Let’s start with seasonal predictability! The World Climate Research Programme WCRP) has advanced seasonal (to interannual) predictions within CLIVAR in the Working Group on Seasonal to Interannual Predictions (WGSIP) Also other projects that have traditionally advanced Seasonal predictions: European projects like: DEMETER, ENSEMBLES Important Centres producing or collecting : ECMWF, NCEP, Meteo-France, Met-Office, APCC, IRI,…… Note that there is a new (more modest goals!) initiative from the WCRP in sub-seasonal to seasonal prediction
Most results presented in the following for the analysis of seasonal predictability are from the ECMWF system3 hindcasts, but the main conclusions are representative for all seasonal forecasting systems. Also note that system 3 has Been relpaced now by system 4 (and improved), but I doubt that there are any really major differences in what I look at. However, the analysis is likely to be biased, examples almost randomly chosen according to my personal taste……. The ECMWF system 3 dataset is a fantastic tool to analyze predictability on many timescales, many more things can be done!!!! For reference of the ECMWF system 3 forecasting system, see Stockdale et al. (2011), Clim Dyn, 37:455–471, DOI 10.1007/s00382-010-0947-3 Thanks to Adrian Tompkins for downloading the data and advise on analysis.
All seasonal-to-climate change forecasts are based on coupled ocean- atmosphere models (or even Earth System models with more components) Explain ensembles and initial conditions! Slide courtesy of Franco Molteni
Examples of Ensembles: ENSO prediction Nothing is certain anymore!! Everything probabilistic! Ensembles are either created by small initial perturbations or simply by combining different model simulations
Uncertainty already in Weather Forecasts: here example for Trieste!
Data used: • Sea Surface Temperature data from Hadley Centre (HadISST) • Rainfall data from Climate Research Unit (CRU) • Other atmospheric fields from NCEP/NCAR re-analysis • ECMWF System3 (ENSEMBLES) hindcasts from 1960 to 2002 • (11 ensemble members); run at T159; about 125 km resolution) • Methods (nothing sophisticated….): • Simple composites based on linear regression: • REG (x,y) = ∑ index(t_i)/sigma(index) field(x,y,t_i) • Field Correlation coefficients: • CORR(x,y) = ∑ index(t_i)/sigma(index) field(x,y,t_i)/sigma(field) • So far consider only forecasts for JJAS (initialized beginning of May) • and DJFM (initialized beginning of November)
BIAS in the System3 forecasts (1960-2002) Initialized in May Cold-tongue problem still there but improved Initialized in Nov In some areas the biases are much larger then the interannual standard deviation. This is common to (probably) all seasonal forecasts and can be corrected using standard bias correction techniques
As mentioned in beginning, seasonal forecasts will mainly depend on the ability to predictable SSTs, in particular ENSO, therefore we consider the seasonal SST forecast Correlation skill Persistence Forecast JJAS DJFM
JJAS Gain in JJAS in ENSO region and DJFM in IO region DJFM
Predictive Skill of Precipitation (point correlation with CRU data) JJAS Regions of relatively large predictive skill MME-persistence DJFM MME Bin Wang et al., Clim dyn, 2008, APCC/Clipas
MME-persistence MME
Results are largely consistent with potential correlation skill (derived from 11 member ensemble, letting one member be the obs and averaging over all correlation skills). This is as good as it can get if model is ‘perfect’. JJAS Regions of relatively large potential predictive skill DJFM Potential skill over land somehow disappointing……
Of course, point-by-point correlation is a very tough test, sometimes a spatial averaging helps a lot to further improves skill (but usually only in regions where the point-by-point correlations already show some skill).
Where do regions of large predictive skill come from? ENSO teleconnections! ENSO Z 200 wavetrain (Nino3.4 regression or composite) DJFM JJAS NCEP SYS3
Where do regions of large predictive skill come from? ENSO teleconnection! ENSO precipitation teleconnection (Nino3.4 regression) CRU SYS3 On each of the teleconnections that we see have been written many, many papers…
Some take-home messages for seasonal predictability: Seasonal hindcasts datasets are very useful to evaluate the skill of real seasonal forecasts. This exercise has to be done, before one can do any downscale exercise! Hindcast skill over land for rainfall and 2m temperature are generally modest, with some increased skill in specific regions. The skill in those regions seems mostly related to ability of models to predict ENSO and its teleconnections. Skill could therefore improve if models could improve also the SST predictions in other regions.
Climate change science and also decadal predictions are currently mainly driven by the Intergovernmental Panel on Climate Change (IPCC) process. Their assessment is since the Fourth Assessment Report (AR4; 2007) based on large World Climate Research Program (WCRP) intercomparison projects: Coupled Model Intercomparison Project (CMIP) phase 5 is the latest one and will be used in the IPCC Fifth Assessment Report (AR5, 2013), whereas phase 3 has been analyzed in AR4.
As for seasonal predictions, the hope for decadal predictability lies with some (very) slowly evolving and hopefully predictable and important components of the climate system. It seems that most promising is SST variability in the extra-tropical North Atlantic, where a phenomenon called Atlantic Multidecadal Oscillation (AMO) occurs. One could almost say that the AMO is for decadal predictability what ENSO is for seasonal predictability, a kind of pacemaker . Ideas for decadal predictions are outlined in Meehl et al. (2009), BAMS, DOI:10.1175/2009BAMS2778.1. The difference between a decadal and climate change prediction lies in the initial conditions: For decadal predictions the initial state of the (deep) ocean Is thought to be relevant (e.g. for AMO state initialization), for climate change predictions the initial state of the (ocean-atmosphere) coupled system is not believed to be relevant. However, it may be that most skill in a decadal prediction (and even in a seasonal prediction) comes from an external forcing, like CO2 increase that leads to a global warming signal.
Paper by Keenlyside et al. (2008), Nature, doi:10.1038/nature06921, that fueled discussions about the use of initialization of climate predictions => Decadal predictions
From a recent paper of Kim et al. (2009), GRL, doi:10.1029/2012GL051644: ‘Evaluation of short-term climate change prediction in multi-model CMIP5 decadal hindcasts’ Many papers on evaluations are just coming out! Assessment of skill of annual mean 2mT and a 4-year mean hindcast from CMIP5 Note that 2-5 Year has more Skill, explain! However, its not clear what is due to initialization and what is due to CO2 increase (global warming). Let’s speculate!
May be for some very large scale indexes there is some Predictability at decadal timescale!
Initialized versus not initialized: Meehl et al., (2013), BAMS, doi: 10.1175/BAMS-D-12-00241.1 Some more skill! 2mT
Some skill here and there Initialized versus not initialized: Meehl et al., (2013), BAMS, doi: 10.1175/BAMS-D-12-00241.1 Annual mean year 6-9 2mT Rain Note that most skill in 2mT is due to global warming!
Some take-home messages for the decadal predictability part: • There seems to be skill for several year means in surface temperature. • There are a few regions with some skill for several year means in • rainfall. • Most of this skill seems to be related to the climate change signal (i.e. • no improvement through initialization). • In some regions, however, initialization lead to some further • improvements, particularly in the North Atlantic => AMO.
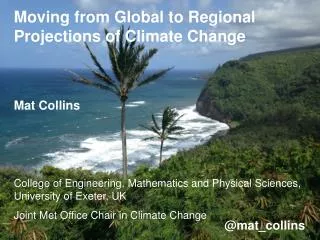
Last, but not least, Climate Change projections. Problem: Hindcast verification not really possible; only one realization of the past (perhaps paleo-climate could give some clues). Therefore we can only verify if results are robust amongst the diverse models. What is new in CMIP5 (IPCC AR5) compared to CMIP3 (IPCC AR4)? Many things, mainly (CLIVAR EXCHANGES on CMIP5, 56, 2011): - Different (but compatible) emission scenarios (discussed later) - Generally higher model resolution - Decadal predictions with initialized models - Paleoclimate intercomparisons - A coordinated regional downscaling experiment (CORDEX) - Special investigations of 'open' research areas such as cloud feedbacks, aerosols, importance of highly resolved stratosphere.
CMIP5 and CMIP3 are fantastic datasets, freely available to analyze climate variability (and change) with relatively high statistical significance (with respect to using re-analysis or observed data). Many processes can also be studied using sub-sets of this data (land-use change, aerosol impacts, ….). Climate research has made enormous progress since this data is available, also because now many studies are published on things the models cannot do (after all it is not your model you are reporting about).
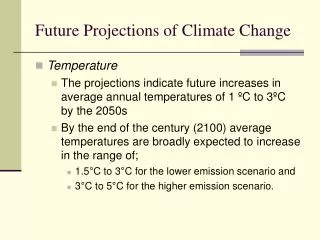
Global mean Surface Temperature
The story may look different if we actually look at regional, seasonal means... Meaning that global mean temperature may not be relevent regionally everywhere.. Figure from Metoffice
Climate projections: Emissions (SRES in AR4 versus RCP in AR5) RCP= Representative Concentration Pathways, SRES=Special Report on Emissions Scenarios Figure from Moss et al. (2008)
Representative Pathways: RCP's We are currently ~ 380 ppm Figure from Moss et al. (2008) Note that the radiative forcing is without climate feedbacks such as water vapor!
How does CMIP5 projections compare with CMIP3? Global mean Surface Temperature Well, if there was hope to reduce uncertainty in CMIP5, one would be disappointed Figure from Knutti et al. (2008)
How does CMIP5 projections compare with CMIP3? Global Surface Temperature change distribution by 2081-2100 minus 1981-2000 Figure from Knutti et al. (2008) Global warming is a robust projection also regionally
How does CMIP5 projections compare with CMIP3? Global precipitation change distribution by 2081-2100 minus 1981-2000 Subtropical drying robust Figure from Knutti et al. (2008) Precipitation changes are less robust regionally
Robust features of Climate Change: 0. Global mean surface temperature rises, but even regionally the surface temperature rises nearly everywhere. Stratospheric temperatures cool. Mechanism: More energy flux is trapped in the lower atmosphere. An alternative explanation is that the radiative equilibrium temperature has to be the same (RS = eps sigma T_eff^4). Since GHG increases the atmosphere becomes optically thicker, the altitude of the radiative surface increases. Since temperature is decreasing with height, the Surface temperature should increase. Mechanism for stratospheric Cooling is again based on (RS = eps sigma T^4), but now we assume local radiative equilibrium in the stratosphere. Then if GHG concentrations increase, the emissivity eps increases and the stratosphere loses locally heat until the temperature is reduced to fulfill balance again.
Note that the radiative Temperature at the radiative surface does not change unless radiative flux from Sun changes Figure from: http://earthguide.ucsd.edu/virtualmuseum/climatechange1
Robust features of Climate Change: 1. 'Rich get richer' effect (Held and Soden, 2006) or wet gets wetter, dry gets drier Mechanisms involve more water vapor in a warmer climate and the 'upped ante' effect. Figure from: GFDL Climate modeling research Highlights (2007)
Robust features of Climate Change: 2. More extreme rainfall events (not necessarily others; see next talk) Mechanisms involve more water vapor in a warmer climate according to Clausius Clapeyron. The tropical circulation, however, weakens → More potential for large rainfall amounts Figure from: Kunkel et al. 2013
What can happen to probability Density functions (PDF) in future climate? Would we call this and extreme event in 2100? This depends on how Extreme events are defined (with respect to a fixed threshold or with respect to the mean climate). It is certainly not due to increased variability of the climate parameter we are looking at. This could be the situation for temperature. This PDF change would indeed have More extreme events in a future climate due to increased variance. This could be rainfall! Figure from ICPP TAR
Robust features of Climate Change: 3. Related to 1. and 2.: The tropical circulation weakens and widens Mechanism: Stratification becomes closer to moist adiabate → Increase in dry static stability → Reduction in vertical velocities and circulations in general Figure from IPCC AR4
Robust features of Climate Change: Why does tropical circulation weaken? In tropical regions we have the approximate balance in the thermodynamic equation: (diabatic heating balanced by adiabatic cooling) S W ~ Q → W~Q/S Where S is a dry static stability parameter proportional to Brunt Vaisala Frequency W is the vertical velocity Q is the heating. The heating increases somewhat (close the the equator), but the static stability increases much more thus reducing the mean vertical motions, and thus as per continuity also the horizontal motions. We could say the the increased static stability makes the vertical velocity more efficient in compensating for the heating. Another way of stating this argument is that in climate change, specific humidity is increasing relatively more than precipitation, therefore the tropical circulations should weaken (Vecchi et al., 2006)
Therefore Pacific mean-state change is likely to be El Nino-like (although less agreement among models), because tradewinds that cool eastern Pacific should weaken. SST-change in CMIP3 models Incidentially: Small variations in the pattern matter (shown in the same paper), And even seem to Determine rainfall Response in many Regions. Figure from Rauscher, Kucharski, Enfield, J Climate, 2011
AGCM forced with SST-change in CMIP3 models reproduce drying in e.g. Central America, highlighting importance of SST change (and its precise structure): Figure from Rauscher, Kucharski, Enfield, J Climate, 2011
Northern Annular Modes (NAM) and Southern Annular Modes (SAM) changes? 500 hPa height Figure from Molteni et al. (2011)
500 hPa height change in CMIP3-type time slice Experiment looks line NAM or AO Figure from Molteni et al. (2011)