Types of Descriptive Research
620 likes | 2.57k Views
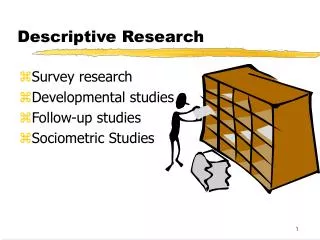
Types of Descriptive Research. The Case Study The Survey Naturalistic Observation. The Case Study. Where one person (or situation) is observed in depth. What are the strengths and weaknesses of using a tragedy like the Columbine School Shootings as a case study?. The Survey Method.

Types of Descriptive Research
E N D
Presentation Transcript
Types of Descriptive Research • The Case Study • The Survey • Naturalistic Observation
The Case Study • Where one person (or situation) is observed in depth. What are the strengths and weaknesses of using a tragedy like the Columbine School Shootings as a case study?
The Survey Method • Used in both descriptional and correlational research. • Use Interview, mail, phone, internet etc…
The Survey Method • What is good about a survey? • cheap, anonymous, diverse population, and easy to get random sampling • a sampling that represents your population you want to study
Why do we sample? • One reason is the False Consensus Effect: • the tendency to overestimate the extent to which others share our beliefs and behaviors.
Survey Method: The Bad • Low Response Rate • People Lie or just misinterpret themselves. • Wording Effects How accurate would a survey be about the frequency of having to use a plunger?
Naturalistic Observation • Observing and recording behavior in natural environment. • No control- just an observer. What are the benefits and detriments of Naturalistic Observation?
Correlational Research • Detects relationships between variables. • Does NOT say that one variable causes another. There is a positive correlation between ice cream and shark attacks. Does that mean that ice cream causes shark attacks?
Measured using a correlation coefficient. • A statistical measure of the extent to which two factors relate to one another
Scatterplots Perfect positive correlation (+1.00) Scatterplotis a graph comprised of points that are generated by values of two variables. The slope of the points depicts the direction, while the amount of scatter depicts the strength of the relationship.
Scatterplots Perfect negative correlation (-1.00) No relationship (0.00) The Scatterplot on the left shows a negative correlation, while the one on the right shows no relationship between the two variables.
Correlational Research • Correlation is the relationship between two variables. • Positive correlation – both values increase • Negative correlation – One variable increases, while the other decreases. • Correlational Coefficient – strength of the relationship 0= no relationship + or – 1 = perfect relationship Examples: SAT scores and success in college; Red wine and heart attacks; Prejudice and age; length of marriage and hair loss, etc.
Scatterplot The Scatterplot below shows the relationship between height and temperament in people. There is a moderate positive correlation of +0.63.
Order in Random Events Given random data, we look for order and meaningful patterns. Your chances of being dealt either of these hands is precisely the same: 1 in 2,598,960.
Order in Random Events Given large numbers of random outcomes, a few are likely to express order. Jerry Telfer/ San Francisco Chronicle Angelo and Maria Gallina won two California lottery games on the same day.
Do not conceive Conceive Adopt Confirming evidence Disconfirming evidence Do not adopt Disconfirming evidence Confirming evidence Illusory Correlation The perception of a relationship where no relationship actually exists. Parents conceive children after adoption. Michael Newman Jr./ Photo Edit
What do each of these show? • The bigger they are, the harder they fall. • The more you save, the less you spend.
Experimental Research • Explores cause and effect relationships.
Steps in Designing an Experiment • Hypothesis • Pick Population: Random Selection then Random Assignment. • Operationalize the Variables • Identify Independent and Dependent Variables. • Look for Extraneous Variables • Type of Experiment: Blind, Double Blind etc.. • Gather Data • Analyze Results
Experimental Vocabulary • Independent Variable: factor that is manipulated • Dependent Variable: factor that is measured • Confounding Variables: factors that effect DV, that are not IV. • Experimental Group: Group exposed to IV • Control Group: Group not exposed to IV • Placebo: inert substance that is in place of IV in Control Group
Analyze Results • Use measures of central tendency (mean, median and mode). • Use measures of variation (range and standard deviation).
A Skewed Distribution Are the results positively or negatively skewed?