Download
1 / 18
280 likes | 733 Views
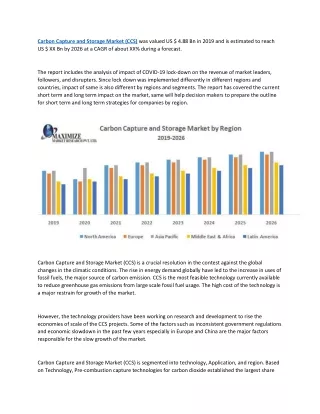
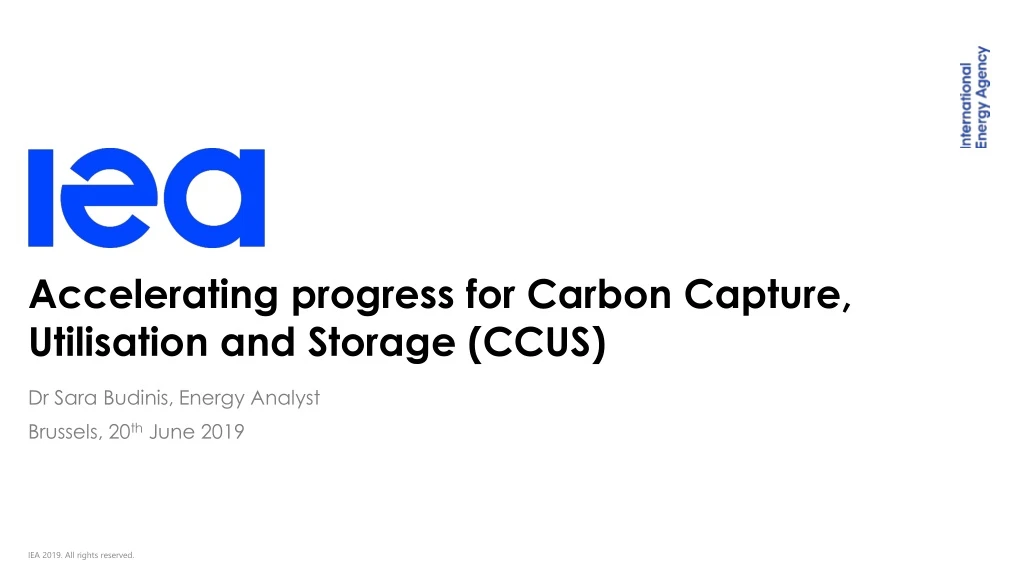
Accelerating progress for Carbon Capture, Utilisation and Storage (CCUS ). Brussels, 20 th June 2019. Dr Sara Budinis, Energy Analyst. 2018 – a remarkable year for energy.

E N D
Accelerating progress for Carbon Capture, Utilisation and Storage (CCUS) Brussels, 20th June 2019 Dr Sara Budinis, Energy Analyst
2018 – a remarkable year for energy Global energy demand last year grew by 2.3%, the fastest pace this decade, an exceptional performance driven by a robust global economy, weather conditions and moderate energy prices. Annual change in global primary energy demand, 2011-18 400 Mtoe Nuclear 300 Coal Oil 200 Renewables 100 Gas 2011 2012 2013 2014 2015 2016 2017 2018
Energy-related CO2 emissions hit a record high… Annual change in global energy-related CO2 emissions, 2014-2018 Higher demand for fossil fuels drove up global CO2 emissions for a second year after a brief hiatus. Increases in efficiency, renewables, coal-to-gas switching and nuclear avoided 640 Mt of CO2 emissions. 600 MtCO2 400 200 0 - 200 2014 2015 2016 2017 2018
..led by coal in power generation in Asia Global energy-related CO2 emissions, 1990-2018 Emissions from coal continue to rise, driven by increasing coal use mostly for power generation in Asia. mostly in Asia hits 10 Gt, the largest source of global emissions. 35 GtCO2 30 Other 25 Other coal use Coal 20 Coal-fired power generation 15 10 5 1990 2000 2010 2018 Emissions from coal continue to rise and account for one-third of the 1°C temperature increase above CCUS is a critical solution and is showing signs of a revival.
Industry is at the heart of the energy transition challenge Industry is the second-largest source of CO₂ emissions after the power sector. Buildings Industry 10% 23% Other 5% Power Transport 39% 23%
Role of fossil fuels in global industrial final energy demand 70% of industrial energy needs are met by fossil fuels, with coal the dominant fuel in iron and steel and cement production
China leads the industrial growth story China accounts for more than one-third of global industrial energy consumption, and almost half of industrial CO₂ emissions
Emissions reductions for cement, iron and steel and chemicals by mitigation strategy CCUS is central to the industry decarbonisation portfolio, contributing 24% of the cumulative emissions reductions from the RTS to the CTS 8 • GtCO₂ Reference Technology Scenario 7 6 CCUS (24%) • Other innovative technologies (4%) 5 • Materials efficiency (24%) • Fuel and feedstock switching (11%) 4 • Energy efficiency & BAT deployment (38%) 3 Clean Technology Scenario 2 1 0 2017 2020 2025 2030 2035 2040 2045 2050 2055 2060
Global cumulative direct CO2 emissions reductions in the CTS, 2017‑60 CCUS is the third-largest decarbonisation mechanism in the iron and steel subsector under the CTS, accounting for 15% of emissions reductions CCUS is the third-largest decarbonisation mechanism in the iron and steel subsector under the CTS, accounting for 15% of emissions reductions, and the most important lever in chemical production.
2018: the beginning of a new era for CCUS? Global CCUS facilities After a decade of muted progress, the investment pipeline is showing signs of growth Source: GCCSI Global Status of CCS
Early opportunities: where is CCUS succeeding, and why? • CCUS installed on existing assets which have sustainable business model from other products • Low technology risk (“keep it simple” approach) • Attractive, well understood storage geology • Coalition of public and private stakeholders • Clear source of revenue to cover CCUS costs over asset lifetime Petra Nova(Source: NRG) Al Reyadah (source: CSLF) ADM Decatur(Source: US DOE) Quest - Scotford Upgrader(Source: Shell)
Funding pledges have not translated to investments Announced government support and capital spending on large-scale CCUS facilities Of almost USD 30 billion in funding commitments, only 15% has actually been spent
Unlocking CCUS investment: 5 keys • Harvest low-hanging fruit to build CCUS deployment and experience from the ground up. • Tailor policies to shepherd CCUS through the early deployment phase and to address unique integration challenges for these facilities. • Target multiple pathways to reduce costs from technology innovation to progressive financial mechanisms. • Build CO2 networks to better support transport and storage options. • Strengthen partnerships and cooperation between industry and government.
Carbon Capture Utilisation and Storage (CCUS) The CCUS chain can be broken down into capture, transport and permanent storage or utilisation; all steps need to be aligned to make the CCUS chain work • CAPTURE • Separation of CO2 produced during production of power or other products, followed by clean-up and compression of the CO2 • TRANSPORT • Movement of CO2 by pipeline, truck, rail, ship, or barge to a storage facility • STORAGE • Injection of CO2 into a suitable storage unit, selected to safely contain the injected CO2 for long timescales • UTILISATION • Using CO2 as a raw material for products or services with a potential market value, including direct (non-conversion) and indirect (conversion) use • or/and
CO₂ capture in cement, iron & steel and chemical subsectors, today through 2060 There is a significant ramp up in CO2 capture in industry to 2060, reaching nearly 1.3 GtCO2captured across cement, iron & steel, and chemical production in the CTS. Iron and steel Chemicals Cement • CO₂ captured (Gt) 0.5 0.5 0.5 0.4 0.4 0.4 0.3 0.3 0.3 0.2 0.2 0.2 0.1 0.1 0.1 0 0 0 Today 2030 2045 2060 Today 2030 2045 2060 Today 2030 2045 2060 Reference Technology Scenario (RTS) Clean Technology Scenario CTS)
Most CCUS associated with high-concentration CO2sources Annual CO2 capture from large-scale CCUS facilities 90% of CO2 captured today is from high-concentration sources, including natural gas processing.