Download
1 / 24
280 likes | 621 Views
Carbon Capture and Storage: overall perspectives. CCS Conference, Gothenburg. January 27, 2009. Agenda for today’s discussion. Why CCS? CO 2 capture and storage (CCS) has the economic logic and potential to be a major CO 2 abatement lever by 2030.

E N D
Carbon Capture and Storage: overall perspectives CCS Conference, Gothenburg January 27, 2009
Agenda for today’s discussion • Why CCS? CO2 capture and storage (CCS) has the economic logic and potential to be a major CO2 abatement lever by 2030 Where do we stand today? Need to address regulatory and funding barriers and then prove technology at scale • What are the implications for the Nordics? A potentially important option for industry–How can/ should that opportunity be addressed?
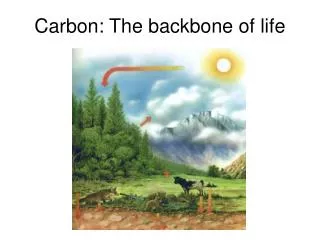
What is CSS? • ILLUSTRATIVE • “Carbon capture and geological storage is a technique for trapping carbon dioxide as it is emitted from large point sources, compressing it, and transporting it to a suitable storage site where it is injected into the ground.” • European Commission / Climate Change: • http://ec.europa.eu/environment/climat/ccs/what_en.htm Source: IEA, European Commission
1.0 2080619 EIB CCS perspectives CCS has potential to be a major abatement lever by 2030 Billion CO2e/year in 2030; EUR 40/ton scenario Vattenfall/McKinsey Cost Curve 2.0 Total 39 bn CO2e/year Stern-report Total 27.6 bn CO2e/year IEA Total 28.7 bn CO2e/year CCS 2.0 1.4 4.0 Renewable 4.5 4.4 Nuclear 2.7 2.7 Source: IEA World Energy Outlook 2007 Stabilization scenario; IPCC FAR, WG III, Summary for Policymakers; Stern-report; McKinsey analysis 4
6.5 IEA business-as-usual forecast of Worldwide electricity generation TWh x 1000 • Fossil fuels • 35.4 • 0.8 • 3.3 • 6.5 • +94% • 0.9 • 18.2 • Biomass and waste • 8.1 • 0.2 • Nuclear • 2.8 • Renewables • 3.1 • 1.2 • Oil • 3.6 • 15.8 • Gas • Coal • 7.3 • 2005 • 2030 Source: World energy outlook, IEA 2007
53 European CO2 emissions from fuel combustion and industrial processes • Total emissions* • 100% = 4.2 GtCO2, 2007 • CCS addressable emissions • 100% = 2 GtCO2, 2007 • Non addres- sable by CCS Power-gas • Addressable by CCS** • 16 Power-oil • 6 Power-other • 1 • Power-coal • 52 • 47 • 9 Cement • 8 Iron & Steel*** • 8 Predominantly large stationary sources Refineries * IEA estimates of CO2 emissions from fuel combustion and industrial processes in 2007. ** Not including biomass, oil sands, paper mills, ammonia, ethanol, ethylene, hydrogen, and other industries *** Includes metal ores processing Source: EEA GHG Emission Trends and Projections 2007; IEA World Energy Outlook 2007; McKinsey analysis
The McKinsey CCS report – CCS: Assessing the economics • The McKinsey CCS report • Key insights • Provides the reference case on economics and European potential of CCS • Developed with over 50 participants • Received as an important contribution by European CCS stakeholders and wide media coverage • Analyzes enablers and barriers – key topics that influence CCS development • Available at www.McKinsey.com Source: McKinsey
Likely development of CCS costs versus carbon price—reference case €/tonne CO2 Demonstration phase: Not economic on standalone basis. Commercial phase: Cost of CCS expected to be in the range of the future carbon price • Estimated cost of CCS Economic gap • Carbon price forecast* • Demonstrationphase (2015) • Early commercial phase (2020+) • Mature commercial phase (2030+) * Carbon price for 2015 from 2008-15 estimates from Deutsche Bank, New Carbon Finance, Soc Gen, UBS, Point Carbon, assumed constant afterwards Source: Reuters; McKinsey analysis
43 CO2 Capture will typically account for well over 50% of value chain cost • CONCEPTUAL • Total cost of early commercial projects – Reference case • €/tonne CO2 abated • Assumption • CO2 capture rate of 90–92% • CCS efficiency penalty of 7–12% points • Same utilization as non-CCS plant (86%) • CO2 compression at capture site • Capture • 25–32 • Transport through onshore/offshore pipeline network of 200/300 km in supercritical state • Use of carbon steel (assumed sufficiently dry CO2) • Transport • 4–6 • Injection depth of 1,500 m in supercritical state • Vertical well for onshore/directional for offshore • Storage • 4–12 • Total • 35–50* * Ranges are rounded to 5 on totals Source: McKinsey analysis
A successful CCS roll-out will likely develop around regional clusters • ILLUSTRATIVE EXAMPLE • Low emissions • Emission and capture cluster • Medium emissions • Storage cluster • High emissions Source: Team analysis; IEA GHG Emissions database v2006; pathfinder; ECOFYS; Gestco summary report
A worldwide roll-out could lead to 400 – 600 plants equipped with CCS, representing a € 500 bln opportunity • ESTIMATES • Roll-out rate: average number of plants equipped with CCS per year (new build or retrofit) • Number of plants equipped with CCS • Worldwide abatement potential of CCS by 2030 of 2.0–2.4 GtCO2 • Europe could account for 20% of this • Total capex to support roll-out likely EUR 300-500 billion • Demonstration plants • Early commercial • plants • Mature commercial • plants • Installed capacity GWe • +15 • +30 • +400 • Yearly abatement potential • GtCO2/y • ~0.05 • ~0.3 • ~2.2 Source: Team analysis
Agenda for today’s discussion • Why CCS? CO2 capture and storage (CCS) has the economic logic and potential to be a major CO2 abatement lever by 2030 Where do we stand today? Need to address regulatory and funding barriers and then prove technology at scale • What are the implications for the Nordic region? A potentially important option for industry–How can/ should that opportunity be addressed?
Maturity of CCS component technologies • Capture • Transport • Storage • Stage of development • Concept • Lab testing • Demonstration • Commercial refinements needed • Commercial • Potential future breakthrough technologies • Several projects are operational (e.g., Weyburn (Canada)). EU has limited EOR potential • First projects are coming online now • Post- combustion • Oxy-fuel • Membranes • Pre-combustion • CO2-EOR • Chemical looping • Depleted oil and gas fields • CO2-EGR • Transport off-shore • Transport • On-shore • Saline aquifers • Sleipner (Norway) field has been operational for around 10 years • US has existing CO2 pipeline network of more than 5000 kilometers Source: Interviews; McKinsey analysis
Examples of key players currently involved in CCS • ILLUSTRATIVE Asia Europe North America l Source: MIT
3 • Unattractive conditions • Attractive conditions Current status and potential of CCS by region • Relative* attractiveness CCS • Total 2030 emissions from point sources • Regulatory and political situation • Availability of storage • Region • North America • China • India • EU • Middle East • Japan • South Korea • Australia • South Africa * Compared to other abatement measures
Status in Europe • ZEP and others for some time have promoted the need for a ‘Flagship Program’—a coordinated portfolio of 10-12 commercial scale demonstration CCS projects • Test the full range of technologies and fuels in multiple geographies, refine economics and build public acceptance • Will require a mix of private and public funding given high costs of demonstration projects, expected requirement €6–10 billion • EU in December endorsed using 300 million EUAs as the public funding contribution to these projects Source: ZEP
EU tender process • Public acceptance • Infrastructure development • Regulatory framework Four ‘next steps’ if widespread CCS deployment is to occur in Europe • Design and run tender process to select ‘flagship’ projects and allocate public funds • Develop national regulatory and legal framework for storage in line with EU directive • Address public awareness and safety concerns to allow project permitting • Develop the ‘blueprint’ for broader deployment—prove up storage capacity, develop pipeline options etc for ‘cluster’ development
Agenda for today’s discussion • Why CCS? CO2 capture and storage (CCS) has the economic logic and potential to be a major CO2 abatement lever by 2030 Where do we stand today? Need to address regulatory and funding barriers and then prove technology at scale • What are the implications for the Nordic region? A potentially important option for industry–How can/ should that opportunity be addressed?
14 Sweden has an industry heavy carbon footprint • Energy Percent; Emissions from power, heat and industry • CO2 intensive industry • Other industry • World • Sweden • Energy • Coal • Gas • Oil • 100% = 22.5 Gton CO2e • 100% = 30.8 Mton CO2e • Other* • Cement • Other industry • 14 • Refineries • Iron & Steel • Iron & • Steel • Oil • 7 • 60 • Coal • 11 • Gas • Cement • Refineries * Ammonia, ethanol, ethylene, hydrogen, biomass, oil and gas processing, oil sands, paper mills, and other industries Source: IEA GHG emissions database 2006; McKinsey analysis (McKinsey KO: Carbon Capture and Sequestration); NRI; Environment reports
Swedish CO2 cost curve—simplified • CCS • Reduction cost, • SEK per tonne CO2e • 5.5 million tonnes of CO2e • emission reduction • 6 000 • 4 000 • CCS,steel • 2 000 • Ethanol(transport) • SEK 500 per • tonne CO2e • 0 • 0.5 • 1.5 • 2.5 • 3.0 • 3.5 • 4.0 • 4.5 • 5.0 • 5.5 • 6.0 • 6.5 • 7.0 • 7.5 • 8.0 • 8.5 • 9.0 • 9.5 • 10.0 • 10.5 • 11.0 • 11.5 • 12.0 • Reduction potential, Millions of tonnes of CO2e • CCS, raff./ • petrochem. • -2 000 • CCS,cement • -4 000 • Energy efficiency measures • Industry, heat and power measures • Transport sector solutions • -6 000 Source: McKinsey analysis
Distribution of CO2 emissions in Sweden Kton CO2 emitted per year • SSAB, Luleå* • Top 10 emission points account for 40% Swedish emissions • Largest emitters generally close to the coast—possible ship based CO2 transport • Gothenburg cluster with ~3.5 million tons CO2 per year • SSAB, Borlänge • Outokumpu, Avesta • Cementa, Skövde • Fortum, Värtaverket • Preem, Lysekil • SSAB, Oxelösund • Borealis, Krackeranläggningen • Shell, Göteborg • Preem, Göteborg * Incuding Lulekraft Source: Swedish Environmental Protection Agency; Environment rapports; McKinsey analysis
Considerations for CCS in the Nordics • FOR DISCUSSION • What are the CO2 capture priorities and at what economics? • West coast Sweden/Norway/Denmark cluster (Skagerack project)? • Swedish Steel? • Other? • What are the optimal transport and storage options for these sites? (local, NCS, shipping?) • Is there a near term opportunity to develop an industrial CCS project under the EU flagship program? What is required in order to do so? • What is required from government and industry more broadly to move forward on developing Nordic CCS? • What broader business opportunities for Nordic companies could be available in CCS?
3,600,000 Top 10 point emitters of CO2 in Sweden • Steel • Refinery MT of CO2 per year • Cement • Energy • SSAB, Luleå* • 3.6 • SSAB, Oxelösund • 2.5 • Other point emitters • 18.2mt CO2 / yr • Preem, Lysekil • 1.7 • Cementa, Skövde • 1.6 • Borealis, Krackeranläggningen • 0.7 • Top 10 emitters • 12.7mt CO2 / yr • 41% • Fortum, Värtaverket • 0.7 • Preem, Göteborg • 0.5 • Shell, Göteborg • 0.5 • Outokumpu, Avesta • 0.4 • SSAB, Borlänge • 0.4 * Including Lulekraft Source: Swedish Environmental Protection Agency; Environment reports; McKinsey analysis