Introduction to Functions and Graphs
401 likes | 722 Views
1. Introduction to Functions and Graphs. 1.3 Functions and Their Representations. Functions and Their Representations. 1.3. Learn function notation Represent a function four different ways Define a function formally Identify the domain and range of a function

Introduction to Functions and Graphs
E N D
Presentation Transcript
1 Introduction to Functions and Graphs 1.3 Functions and Their Representations
Functions and Their Representations 1.3 Learn function notation Represent a function four different ways Define a function formally Identify the domain and range of a function Use calculators to represent functions (optional) Identify functions Represent functions with diagrams and equations
Basic Concepts The following table lists the approximate distance y in miles between a person and a bolt of lightning when there is a time lapse of x seconds between seeing the lightning and hearing the thunder. The value of y can be found by dividing the corresponding value of x by 5.
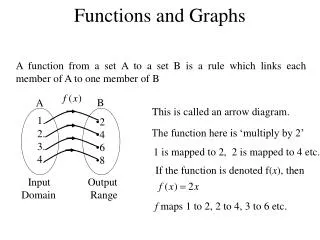
Basic Concepts This table establishes a special type of relationship between two sets of numbers, where each valid input x in seconds determines exactly one output y in miles. The table represents or defines a function f, where function fcomputes the distance between an observer and a lightning bolt.
Basic Concepts The distance y depends on the time x, and so y is called the dependent variable and x is called the independent variable. The notation y = f(x) is used to emphasize that f is a function (not multiplication). It is read “y equals f of x” and denotes that function f with input x produces output y. That is, f(Input) = Output
Function Notation The notation y=f(x) is called function notation. The input is x, the output is y, andthe name of the function is f. Animation: Input and Output of a Function d Name y = f(x) Output Input
Function Notation The variable yis called the dependent variable, and the variable xis called theindependent variable. The expression f(20)= 4 is read “f of 20 equals 4” and indicates that f outputs 4 when the input is 20. A function computes exactly one output foreach valid input. The letters f, g, and h are often used to denote names of functions.
Domain and Range of a Function • The set of all meaningful inputsx is called the DOMAINof the function. • The set of corresponding outputsy is called the RANGE of the function. Animation: Domain and Range of a Function A function f that computes the height after t seconds of a ball thrown into the air, has a domain that might include all the times while the ball is in flight, and the range would include all heights attained by the ball.
Representation of Functions Functions can be represented by • Verbal descriptions • Tables • Symbols • Graphs
Verbal Representation (Words) In the lightning example, “Divide x seconds by 5 to obtain y miles.” OR “f calculates the number of miles from a lightning bolt when the delay between thunder and lightning is x seconds.”
Numerical Representation(Table of Values) Here is a table of the lightning example using different input-output pairs (the same relationship still exists): Since it is inconvenient or impossible to list all possible inputs x, we refer to this type of table as a partial numerical representation.
Symbolic Representation (Formula) In the lightning example, Similarly, if a function g computes the square of a number x, then
Graphical Representation (Graph) A graph visually pairs and x-input with a y-output. Using the lightning data:
Graphical Representation (Graph) The scatterplot suggests a line for the graph of f.
Formal Definition of a Function A function is a relation in which each element of the domain corresponds to exactly one element in the range. The ordered pairs for a function can be either finite or infinite.
(a) Example 3: Evaluating a function and determining its domain Let a function f be represented symbolically by (a) Evaluate f(3) and f(a + 1) (b) Find the domain of f. Solution
Example 3: Evaluating a function and determining its domain Solution (continued) (b) The expression for f is not defined when the denominator x2 – 1 = 0, that is, when x = –1 or 1. So the domain of f is all real numbers except for –1 and 1. (a)
Set-Builder Notation The expression {x | x ≠ –1, x ≠1} is written in set-builder notation and represents the set of all real numbers x such that x does not equal –1 and x does not equal 1. Another example is {y | 1 < y < 5}, which represents the set of all real numbers y such that y is greater than 1 and less than 5.
Example 4: Evaluating a function symbolically and graphically A function g is given by g(x) = x2 – 2x, and its graph is shown. Find the domain of g. Use g(x) to evaluate g(–1). (c) Use the graph of g to evaluate g(–1).
(c) Find x = –1 on the x-axis. Move upward to the graph of g. Move across to the y-axis. Read the y-value: g(–1) = 3. Example 4: Evaluating a function symbolically and graphically Solution (a) The domain for g(x) = x2 – 2x, is all real numbers. g(–1) = (–1)2 – 2(–1) = 1 + 2 = 3
Example 5: Find the domain and range graphically A graph of is shown. Find the domain and range of f.
Example 5: Find the domain and range graphically Solution Arrow indicates x and y increase without reaching a maximum. Domain is in green: D = {x | x ≥ 2} Range is in red: R = {y | y ≥ 0}
Identifying Functions: Vertical Line Test If every vertical line intersects a graph at no more than one point, then the graph represents a function. Note: If a vertical line intersects a graph more than once, then the graph does not represent a function.
Example 9: Identifying a function graphically Use the vertical line test to determine if the graph represents a function. (a) (b) Solution (a) Yes (b) No
Functions Represented by Diagrams and Equations There are two other ways that we can represent, or define, a function: • Diagram • Equation
Diagrammatic Representation (Diagram) Function Sometimes referred to as mapping; 1 is the image of 5; 5 is the preimage of 1.
Diagrammatic Representation (Diagram) Not a function
Functions Defined by Equations The equation x + y = 1 defines the function f given by f(x) = 1 – x where y = f(x). Notice that for each input x, there is exactly one y output determined by y = 1 – x.
Example 10: Identifying a function Determine if y is a function of x. (b) y = x2 – 2 (a) x = y2 Solution (a) If we let x = 4, then y could be either 2 or –2. So, y is not a function of x. The graph shows it fails the vertical line test.
Example 10: Identifying a function Solution (continued) (b) y = x2 – 2 Each x-value determines exactly one y-value, so y is a function of x. The graph shows it passes the vertical line test.
Key Ideas for this section: • What is a dependent/independent variable? • What are the four ways we can represent a function? • What is the domain/range? • What is the formal definition of a function? • What is set-builder notation and how do we use it?
Key Ideas for this section: • How do we evaluate a function? • What two important things do we look for when we are determining the domain of a function? • How do we find the domain and range graphically? • What is the vertical line test and how do we use it? • When is a relation not a function?
Key Ideas for this section: • What is a mapping and how do we use it? • How do we show that a relation is not a function using a mapping/