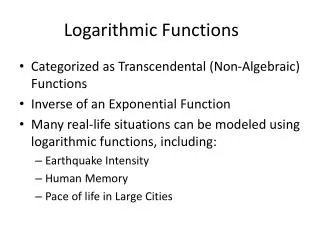
Logarithmic Functions and Graphs
460 likes | 565 Views
Learn about logarithmic functions, their graphs, properties, and applications in modeling data. Explore how to solve logarithmic equations, graph functions, and use logarithmic and natural logarithmic functions.

Logarithmic Functions and Graphs
E N D
Presentation Transcript
Objective Sketch Logarithmic Graphs Use Log Properties
Relevance Log functions are useful for modeling data that represent quantities that increase or decrease slowly. For example, a log function can model the minimum required ventilation rates in public school classrooms.
Warm Up - If $5,000 is invested at an interest rate of 5% per year, find the amount of the investment at the end of 5 years for the following compounding methods: • Annually • Monthly • Quarterly • Continuously
Annually: Monthly:
Quarterly: Continuously
Warm Up Solve: Find the Vertex:
Logarithmic Function • It’s the inverse of the exponential function Switch the x’s and the y’s!
Logarithmic Function Used to find unknown exponents in exponential models. Logs define many measurement scales in the sciences: 1) ph 2) decibal 3) Richter scale
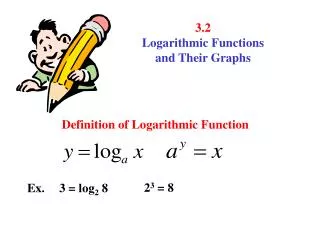
For any positive base b, where b≠1: bx = y if and only if x = logby Exponential Form Logarithmic Form
Graph: Is the inverse of Domain: Range: Domain: Range:
Graph: Up 3 from previous example! Domain: Range:
Graph: Left 4 from Original Example! Domain: Range:
Graph: Right 2 from Original Example! Domain: Range:
Graph: Reflected over y-axis. Domain: Range:
Graph: Reflected over x-axis. Domain: Range:
The Natural Logarithmic Function • The natural logarithmic function is the inverse of the natural exponential function