Download
1 / 10
100 likes | 240 Views
LC3B gE. Fig. S1. Z-stack of cells in a VZV vesicle smear. (A-H) Slices from bottom to top in increments of 1 m m. Green = autophagosomes ; red = VZV gE . A1. A2. A3. LC3B DNA. A4. Fig S2 A. Z-stack of MRC-5 fibroblast cells treated with tunicamycin for 24 h.

E N D
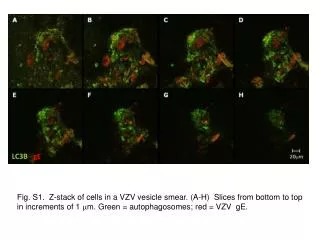
LC3BgE Fig. S1. Z-stack of cells in a VZV vesicle smear. (A-H) Slices from bottom to top in increments of 1 mm. Green = autophagosomes; red = VZV gE.
A1 A2 A3 LC3BDNA A4 Fig S2 A. Z-stack of MRC-5 fibroblast cells treated with tunicamycin for 24 h. Slices A1 – A5 from top to bottom in increments of 0.8 mm. Note LC3B puncta indicative of autophagosomes A5 50 mm
B1 B2 B3 LC3BDNA B4 B5 Fig. S2 B. Z-stack of MRC-5 fibroblast cels treated with tunicamycin for 24 h. Slices B1 – B5 from top to bottom in increments of 0.5 mm. Note LC3B puncta indicative of autophagosomes. 50 mm
C1 C2 C3 LC3BDNA C4 C5 Fig S2 C. Z-stack of MRC-5 fibroblast cells treated with tunicamycin for 24 h. Slices C1 – C5 from top to bottom in increments of 0.5 mm. Note LC3B puncta indicative of autophagosomes. 50 mm
D1 D2 D3 LC3BDNA D5 D4 Fig S2 D. Z-stack of MRC-5 fibroblast cells Slices D1 – D5 from bottom to top in increments of 0.5 mm. 50 mm
E1 E2 E3 LC3BDNA E4 E5 Fig S2 E. Z-stack of MRC-5 fibroblast cells Slices E1 – E5 from bottom to top in increments of 0.75 mm. 50 mm
F1 F2 F3 LC3BDNA F4 F5 Fig S2 F. Z-stack of MRC-5 fibroblast cells Slices F1 – F5 from bottom to top in increments of 0.75 mm. 50 mm
A B C LC3BIE62DNA E F D 50 mm Fig S3. HeLa cells transiently transfected with PCMV_IE62 plasmid for 12 h.
G H I LC3BIE62DNA K L J 50 mm Fig S3. HeLa cells transiently transfected with PCMV_IE62 plasmid for 12 h
M N O LC3BIE62DNA Fig S3. HeLa cells transiently transfected with PCMV_IE62 plasmid for 12 h. Green = autophagosomes; red = VZV IE62 protein; blue = Nuclear dye. 50 mm