Download
1 / 44
440 likes | 601 Views
September 2013 . Disruptive Demographic Trends in North Carolina . James H. Johnson, Jr. Frank Hawkins Kenan Institute of Private Enterprise Kenan-Flagler Business School University of North Carolina at Chapel Hill. OVERVIEW. Demographic Trends Challenges & Opportunities Discussion.

E N D
September 2013 Disruptive Demographic Trends in North Carolina James H. Johnson, Jr. Frank Hawkins Kenan Institute of Private Enterprise Kenan-Flagler Business School University of North Carolina at Chapel Hill
OVERVIEW • Demographic Trends • Challenges & Opportunities • Discussion
CENSUS 2010 what will REVEAL September 2013
6 DISRUPTIVE TRENDS • The South Rises – Again • The Browning of America • Marrying Out is “In” • The Silver Tsunami is About to Hit • The End of Men? • Cooling Water from Grandma’s Well… and Grandpa’s Too!
The South Continues To Rise ...Again!
SOUTH’S SHARE OF U.S. NET POPULATION GROWTH, SELECTED YEARS, 1910-2010
NET MIGRATION TRENDS, 2000-2008 = Net Import = Net Export
The Numbers Legal Immigrants Refugees, Parolees, Asylees
NON-IMMIGRANTS ADMITTED TO UNITED STATES, SELECTED YEARS, 1981-2011
NON-WHITE AND HISPANIC SHARES OF POPULATION GROWTH, 2000-2010
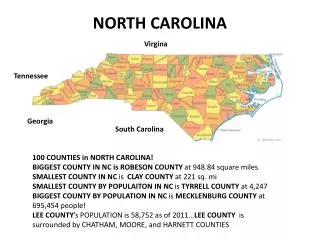
THE “BROWNING” OF NORTH CAROLINA Immigration-Driven Population Change
NORTH CAROLINA POPULATION GROWTH BY NATIVITY, RACE, AND ETHNICITY, 1990-2007
CONTRIBUTIONS OF NON-WHITES & HISPANICS TO NC POPULATION CHANGE, 2000-2010 Source: Census 2000 and Census 2010. *Non-whites include Blacks, Hispanics, American Indians and Alaskan Natives, Asians, Native Hawaiians & Pacific Islanders, and people of two or more races.
CHANGE IN THE RACE/ETHNIC COMPOSITION OF NC PUBLIC SCHOOLS, 2000-2009 . Source: DPI, The Statistical Profile Online
NC COUNTIES WITH THE LARGEST ABSOLUTE POPULATION GAINS, 2000-2010
U.S. POPULATION TURNING 50, 55, 62, AND 65 YEARS OF AGE, (2007-2015)
DEPENDENCY RATIOS IN THE AMERICAN SOUTH Source: Census 2010
Distribution of Widowed Elderly Women by County, The Carolinas, 2010
MEDIAN AGE & FERTILITY RATES FOR FEMALES IN NC, 2005-2009 . Source: American Community Survey *Women 15 to 50 with births in past 12 months
RELATIVE DISTRIBUTION OF U.S. BIRTHS BY RACE / ETHNICITY Source: Johnson and Lichter (2010); Tavernise (2011).
Conceptual Framework for Assessing the Economic Impact of Immigrants
Projected Changes in U.S. Buying Power by Race/Ethnicity, 2010-2015
Moving Forward • Recognize that we are aging • Embrace immigrants • We need young talent to propel our economy and to pay the bills • Recognize the business and job creation potential of diverse ethnic markets