Download
1 / 6
60 likes | 87 Views
This study evaluates the impact of a statin-based endothelium protection regimen for GVHD prophylaxis post allogeneic stem cell transplantation. It analyzes the incidence of thrombotic microangiopathy and non-relapse mortality in patients with and without statins. Additionally, serum markers for endothelial vulnerability are assessed for their association with TMA incidence. Results indicate no significant differences between cohorts. The study uses Cox regression analysis to assess the influence of statin-based protection on TMA incidence in patients with different endothelial risk profiles.

E N D
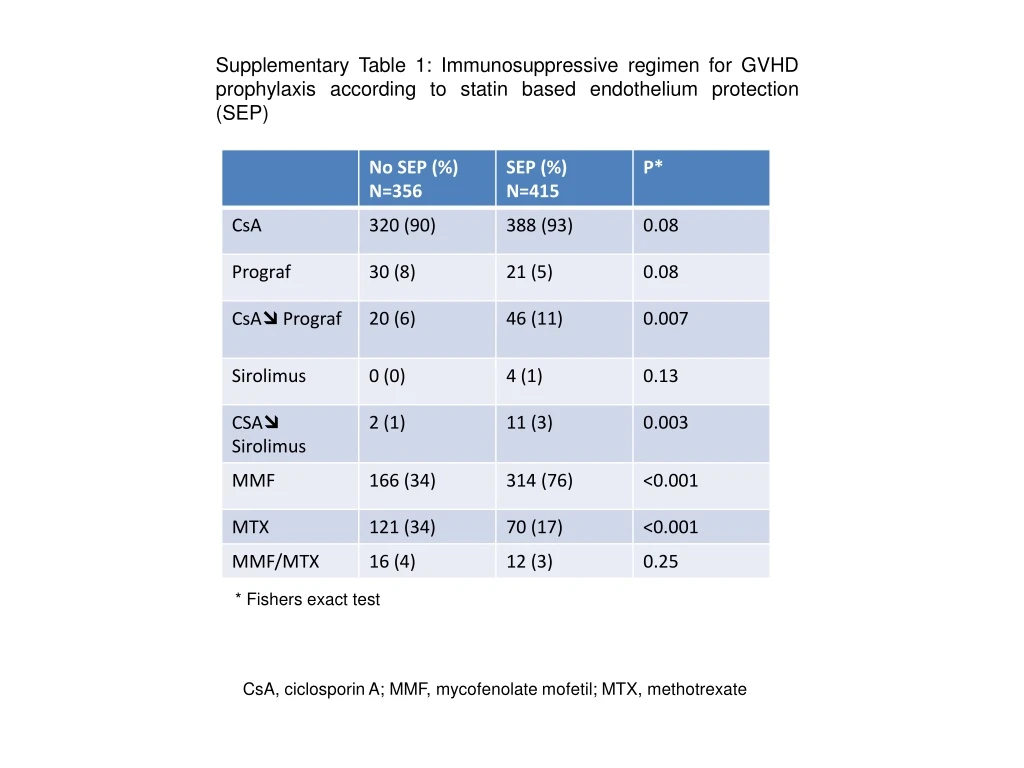
Supplementary Table 1: Immunosuppressive regimen for GVHD prophylaxis according to statin based endothelium protection (SEP) * Fishers exact test CsA, ciclosporin A; MMF, mycofenolate mofetil; MTX, methotrexate
Suppl. Figure 1 TMA NRM Statins.mono Statins.mono Statins.Ursofalk Statins.Ursofalk 1.0 1.0 0.8 0.8 Whole cohort with statins n=445 0.6 0.6 Cumulative Incidence Cumulative Incidence 0.4 0.4 0.2 0.2 0.0 0.0 0 20 40 60 80 0 20 40 60 80 Time since alloTPL [months] Time since alloTPL [months] Supplementary Figure 1: Non-relapse mortality (NRM) and thrombotic microangiopathy (TMA) in patients taking statins alone (n=65) or statins plus ursodeoxycholic acid (UDCA, n=350). No significant differences were found between the two cohorts.
Suppl. Figure 2 LDH Platelets GFR 500 600 120 p=0.273 p=0.002 p=0.106 500 400 100 400 80 300 platelets (/nL) GFR (mL/min*1.73m2) LDH (U/L) 300 60 200 200 40 100 20 100 0 0 0 C3 VEGF/platelets IL-33 2.5 TMA CKD p=0.227 p=0.256 p=0.571 CKD CKD CKD CKD CKD TMA TMA TMA TMA TMA 14 12.5 2.0 12 10 10 1.5 7.5 8 C3 (g/L) VEGF/plateltes IL-33 (pg/mL) 1.0 6 5.0 4 0.5 2.5 2 0 0 0 Suppl. Figure 2: Markers for TMA and CKD Kruskal-Wallis tests of serum markers measured at disease onset in patients with rTMA (n=12) and CKD (n=18). GFR, glomerular filtration rate; LDH, lactate dehydrogenase; C3, complement factor 3; VEGF, vascular endothelial growth factor; IL-33, interleukin-33; CKF, chronic kidney disease; TMA, thrombotic microangiopathy
Suppl. Figure 3 ST2<1180 pg/mL Nitrates <26.5 µM ST2>1180 pg/mL Nitrates >26.5 µM THBD lowrisk THBD high risk Supplementary Figure 3: Pre-transplant endothelial vulnerability markers in patients with statin-based endothelial protection do not associate with TMA incidence after alloSCT (see Figure 3) THBD SNPs (n=153): genetic high risk vs. low risk, p=0.905. Serum nitrate levels (n=156):>26.5µM vs≤26.5 µM, p=0.794. ST2 (n=384):>1180ng/mL vs<1180 ng/mL: p=0.480. P-values are calculated using the Gray test. THBD: thrombomodulin gene, ST2: suppressor of tumorigenicity, soluble protein
Suppl. Figure 4 • Impact ofStatin-basedendothelialprotection (SEP) on theincidenceof TMA in endotheliallowriskpatients • Table: • Univariable Cox-Regression analysistoassessinfluenceof SEP on incidenceof TMA. no SEP, n=73 + SEP, n=22 no SEP, n=258 no SEP, n=155 no SEP, n=186 + SEP, n=126 + SEP, n=93 + SEP, n=260 n HR lower CI higher CI p no SEP, n=186
Suppl. Figure 4 B) Impact of Statin-based endothelial protection (SEP) on the incidence of TMA in endothelial high risk patients Table: Univariable Cox-Regression analysis to assess influence of SEP on incidence of TMA. no SEP, n=190 + SEP, n=45 no SEP, n=53 no SEP, n=106 no SEP, n=56 + SEP, n=27 + SEP, n=63 + SEP, n=124 n HR lower CI higher CI p


