Download
1 / 8
80 likes | 197 Views
Explore the world of raster data, its variations, and applications for fun and work. Learn how to access, utilize, and differentiate raster pictures for various purposes efficiently.

E N D
Table of content ? WhatWho Why WWW ———————————— 2D / 3D ———————————— Free / not free For work / for fun Conclusions ———————————— Perspectives
What... are pictures? ? Pictures are raster data pixels, not vectors...but… - pictures taken on the field - scanned documents: plans, newspaper… - orthorectified pictures - all other raster data: DTM, remote sensing, vectors… The differences between these pictures: - some of them are XY(Z,T) referenced, some of them are not - informed or not = implicit and explicit metadata - their use
Who … Why ? For fun: I’m just…curious, I wan’t to plan my vacancies - I need pictures related to an XY location - But I don’t care about XY… - I don’t need expensive tools to display them - I need only “visual” pictures, except for the weather forecast… For work: I’m a bit more serious: I’m a planner, a business man, a scientist… - I need XY related data - I need not only visual data but all possible kinds of data (Z, T, X) - I need all these data to be informed
Where... How Where? 2D orthophoto / satellite (visible channel) Norge i Bilder www.norgeibilder.no Plans GisLinkwww.gislink.no GeoNordlandwww.geono.no Some other raster data GisLinkwww.ngu.no GeoNorgewww.geonorge.no DirNatwww.dirnat.no How? 2D WMS + web tools ArcGIS, GisLine… 3D… free tools: GoogleEarth… (really) not free: ArcGIS MapInfo Imagine…
Conclusions...perspectives Other raster data for Nordland? Satellite (1-10 m?) Diversity: SAR (Synthetic Aperture Radar), Laser topo, SST, currents… More WMS for planners More documentation Another way for showing data? Relate raster to vectors as informative DB A central administration of raster data? homogeneity, standardization…
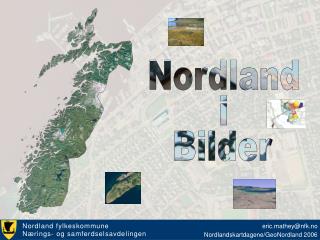
Nordland i Bilder Thanks for your attention