Download
1 / 2
20 likes | 45 Views
Benchmarks: A Yardstick for Investments. How do you know how well your investments are performing? Looking at an investment's total return is one way, but it only tells part of the story. There's a benchmark index for just about every type of investment.

E N D
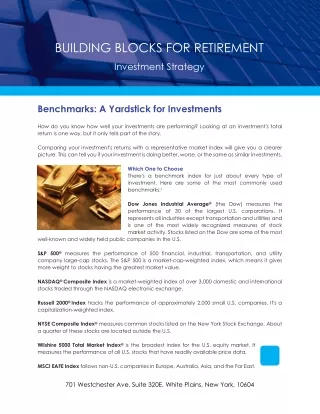
BUILDING BLOCKS FOR RETIREMENT Investment Strategy Benchmarks: A Yardstick for Investments How do you know how well your investments are performing? Looking at an investment's total return is one way, but it only tells part of the story. Comparing your investment's returns with a representative market index will give you a clearer picture. This can tell you if your investment is doing better, worse, or the same as similar investments. Which One to Choose There's a benchmark index for just about every type of investment. Here are some of the most commonly used benchmarks:1 Dow Jones Industrial Average® (the Dow) measures the performance of 30 of the largest U.S. corporations. It represents all industries except transportation and utilities and is one of the most widely recognized measures of stock market activity. Stocks listed on the Dow are some of the most well-known and widely held public companies in the U.S. S&P 500® measures the performance of 500 financial, industrial, transportation, and utility company large-cap stocks. The S&P 500 is a market-cap-weighted index, which means it gives more weight to stocks having the greatest market value. NASDAQ® Composite Index is a market-weighted index of over 3,000 domestic and international stocks traded through the NASDAQ electronic exchange. Russell 2000® Index tracks the performance of approximately 2,000 small U.S. companies. It's a capitalization-weighted index. NYSE Composite Index® measures common stocks listed on the New York Stock Exchange. About a quarter of these stocks are located outside the U.S. Wilshire 5000 Total Market Index® is the broadest index for the U.S. equity market. It measures the performance of all U.S. stocks that have readily available price data. MSCI EAFE Index follows non-U.S. companies in Europe, Australia, Asia, and the Far East. 701 Westchester Ave, Suite 320E, White Plains, New York, 10604
Bloomberg Barclays Capital U.S. Aggregate Bond Index measures U.S. investment-grade bonds. It includes government, corporate, mortgage-backed, and asset-backed securities. Finding the Best Fit You'll need to find an applicable benchmark index that reflects your investments. For example, investors view the Wilshire 5000 Total Market Index as an index for the overall stock market. The MSCI EAFE Index is an important benchmark for international stocks. Bond investors often use the Bloomberg Barclays Capital U.S. Aggregate Bond Index to measure their performance. If you are investing in mutual funds, the applicable benchmark is shown in the fund's prospectus. How to Get the Most from Benchmarks Compare your investment's returns against a benchmark over one-, five-, and 10-year periods, if possible. This will give you a better sense of how well your investments have performed. And remember, a couple of years of low returns may not be a reason to sell an investment that has performed well over the long term. Your financial professional can review your portfolio and help you determine if any changes need to be made. 1Indexes are unmanaged. You cannot invest directly in an index. Past performance cannot predict future results. This material is provided solely for informational purposes and does not constitute investment, tax, legal or accounting advice on the matters addressed. Neither Pentegra Services, Inc., its subsidiaries, nor any of their respective employees intend that this material should be relied on as investment advice, which should be sought from a professional advisor. Performance information shown reflects past performance and does not indicate or guarantee future investment results. Current and future results may be lower or higher than those shown. ©2019 Pentegra Retirement Services 701 Westchester Ave, Suite 320E, White Plains, New York, 10604