Download
1 / 42
420 likes | 564 Views
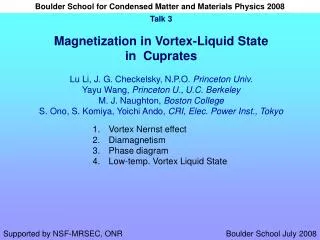
Vortex-Nernst signal and extended phase diagram of cuprates. Yayu Wang, Z. A. Xu, N.P.O (Princeton) T. Kakeshita, S. Uchida (U. Tokyo) S. Ono and Y. Ando (CRIEPI, Japan) D. A. Bonn, R. Liang, W.N. Hardy (U. Brit. Colum.) G. Gu (Brookhaven Nat. Lab.) B. Keimer (MPI, Stuttgart)

E N D
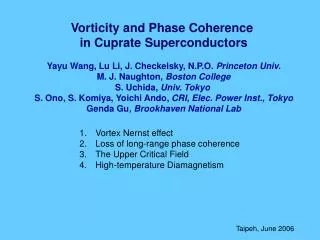
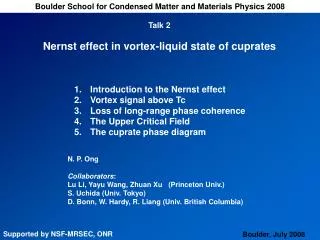
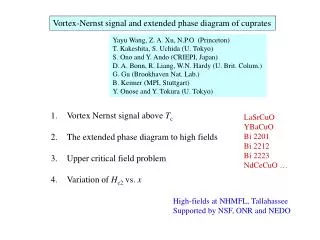
Vortex-Nernst signal and extended phase diagram of cuprates Yayu Wang, Z. A. Xu, N.P.O (Princeton) T. Kakeshita, S. Uchida (U. Tokyo) S. Ono and Y. Ando (CRIEPI, Japan) D. A. Bonn, R. Liang, W.N. Hardy (U. Brit. Colum.) G. Gu (Brookhaven Nat. Lab.) B. Keimer (MPI, Stuttgart) Y. Onose and Y. Tokura (U. Tokyo) • Vortex Nernst signal above Tc • The extended phase diagram to high fields • Upper critical field problem • Variation of Hc2 vs. x LaSrCuO YBaCuO Bi 2201 Bi 2212 Bi 2223 NdCeCuO … High-fields at NHMFL, Tallahassee Supported by NSF, ONR and NEDO
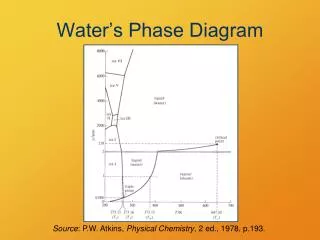
normal ? ? liquid vortex liquid H Hm Hc2 vortex solid vortex solid Hm Hc1 Hc1 0 Tc0 0 Tc0 T T Hc2 coherence length x0 Phase diagram of type II superconductor cuprates 2H-NbSe2 H Upper critical field Hc2 = f0/2px02
Vortices move in a temperature gradient Phase slip generates Josephson voltage 2eVJ = 2ph nV EJ = B x v Nernst experiment
Nernst coefficient v = ey / B Nernst signal ey = Ey / | T | Nernst signal versus field at fixed T in LaSrCuO (x = 0.12)
Bi2Sr2-yLayCu2O6 Tc = 28 K Nernst signal survives up to 80 K
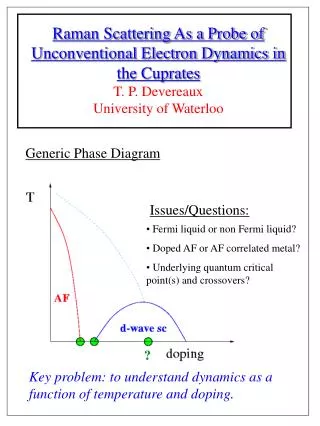
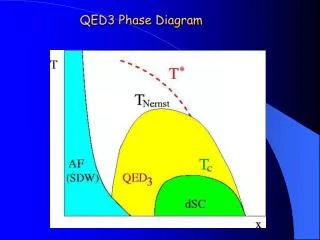
T* • Nernst signal extends up to Tonset ~ T*/2 • Vanishing of phase coherence at Tc0 • (RVB, Baskaran et al., ’87 • Kivelson, Emery ‘95) • Pseudogap state nearly degenerate with dSC • Strong fluctuations between the two states 0
Ridge field H*(T) Tco • Contour plot of Nernst signal ey in T-H plane • Vortex signal extends above Tc0continuously
As x increases, vortex-liquid regime shrinks rapidly, Hm(T) moves towards H*(T). Where is Hc2 line?
T=1.5K T=8K Hd Hc2 0.3 1.0 H/Hc2 • Upper critical Field Hc2 given by ey 0. • Hole cuprates --- Need intense fields. PbIn, Tc = 7.2 K (Vidal, PRB ’73) Bi 2201 (Tc= 28 K, Hc2 ~ 48 T) ey Hc2
Nernst signal ey in overdoped LaSrCuO ey attains a T-dept. maximum, and goes to 0 at large H. By extrapolation, Hc2(0) ~ 50 Tesla. Nernst signal ey in PbIn.
Tco • Three field scales • Hm(T), H*(T), and Hc2(T). • Hc2 vs. T curve does not terminate at Tc0 (remains large) H* Phase coherence lost at Tc0 but D is finite Hm
Tco Contour plots in underdoped YBaCuO6.50 (main panel) and optimal YBCO6.99 (inset). • Vortex signal extends above • 70 K in underdoped YBCO, • to 100 K in optimal YBCO • High-temp phase merges • continuously with vortex • liquid state
Hc2 determined by ey 0 • H* fixed by peak in ey • ey vanishes above Tc0 • (unlike in hole doped) Vortex-Nernst signal in Nd2-xCexCuO4 (x = 0.15)
Plot of Hm, H*, Hc2 vs. T • Hm and H* similar to hole-doped • However, Hc2 is conventional • Vortex-Nernst signal vanishes just above Hc2 line
Hole-doped cuprates NbSe2 NdCeCuO Hc2 Hc2 Hc2 Hm Hm Hm Tc0 Tc0 Tc0 Vortex liquid phase is dominant. Loss of phase coherence at Tc0 (zero-field melting) ‘Conventional’ Amplitude transition at Tc0 (BCS) Expanded vortex liquid Amplitude trans. at Tc0
optimum overdoped underdoped Field scale increases as x decreases
Scaling of ey near Tc0 • Curves at Tc0 obey scaling behavior ey/eymax = F(h) • Allows Hc2(Tc0) to be determined.
STM • Hc2increases as x decreases (like ARPES gap D0) • Compare xH (from Hc2) with • Pippard length x0 = hvF/aD0 (a = 3/2) • STM vortex core xSTM ~ 22 A Hc2 and D0 vs. x in Bi 2212 Coherence length vs. x This work ARPES Feng et al. Science, 99 Ding et al. PRL 2001 Hudson et al. PRL 2001
Pair potential Pair potential rs rs ? Tc0 Tc0 x x Implications of Hc2 vs. x • Pair potential largest in underdoped • (RVB theory, … Baskaran ‘87) • Loss of phase coherence fixes Tc0 • (Emery Kivelson 1995) • Tc0 suppression at 0.05 not driven by competing order?
Resistivity is a bad diagnostic for field suppression of pairing amplitude Plot of r and ey versus T at fixed H (33 T). Vortex signal is large for T < 26 K, but r is close to normal value rN above 15 K.
Hc2 Hc2 Resistivity does not distinguish vortex liquid and normal state
Summary 1. Vortex Nernst signal above Tc in LaSrCuO, YBaCuO, Bi 2201, Bi 2212, Bi 2223, NdCeCuO…. 2. Contour plots of ey Smooth continuity between incoherent vortex regime and vortex liquid 3. Hc2 determined in overdoped regime Hc2(0) = 50 T for x = 0.20 in LSCO Hc2 vs. T does not terminate at Tc0 Phase coherence lost at Tc0 but Hc2 and D are finite 4. Hc2 vs. x determined from scaling. Hc2largest in underdoped regime
Isolated off-diagonal Peltier current axy versus T in LSCO Vortex signal onsets at 50 and 100 K for x = 0.05 and 0.07
Line entropy sf vs. H in LaSrCuO sf = f0ey/r. At large H, sf goes to zero linearly. Intercept gives Hc2(T).
|M| sf Hc2 0 H sf = “transport line-entropy” of vortex -hv -sfT gradient fT = -sfT friction -hv - T ey = Bsf/h = sfr/f0 Ey = Bvx sf= f0 ey/r Tsf = f0 |M(T,H)| LD(T) near Hc2 line (Caroli Maki ’68)
Underdoped Overdoped Nernst signal in underdoped YBaCuO (Tc = 50 K) and overdoped LaSrCuO (Tc = 29 K). Intrinsic field scale much higher in underdoped YBCO.
x0 Js(r) Js(r) x* f0 H* = 2px*2 Cheap, fat vortices A new length scale x* x0 D(r) D(r) 0 0 Is H* determined by close-packing of fat vortices?
Temp. dependence of Nernst coef. in Bi 2201 (y = 0.60, 0.50). Onset temperatures much higher than Tc0 (18 K, 26 K).
Diffusion of vortices produces Josephson E-field E = B x v Charge currents in normal state (top view): J = s.E and J’ = a.(-dT) Nernst signal very small
Ettinghausen-Nernst signal in PbIn (Tc = 7.1 K) ey peaks within vortex state. sf linear in (Hc2- H) near Hc2. Caroli-Maki Tsf = f0 |M(T,H)| LD(T)