Phase Diagram
Phase Diagram. EUTECTIC SYSTEMS. EUTECTIC SYSTEMS. Many pair of elements and compounds are unlikely to satisfies complete solid solubility. Size difference up to 15% A very small amount of any component will always dissolve in any other components.


Phase Diagram
E N D
Presentation Transcript
Phase Diagram EUTECTIC SYSTEMS
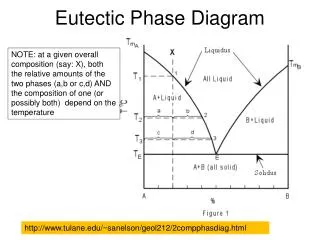
EUTECTIC SYSTEMS • Many pair of elements and compounds are unlikely to satisfies complete solid solubility. • Size difference up to 15% • A very small amount of any component will always dissolve in any other components. • When a solubility is limited and melting point of two components are not vastly different , an eutectic phase diagram is usually results.
BINARY EUTECTIC SYSTEMS • Components are completely soluble in liquid state while completely insoluble in solid state. • Components are completely soluble in liquid state but limited solubility in solid state.
BINARY EUTECTIC SYSTEMS • Copper–Silver system
Features of Copper–Silver system • Three single-phase regions are found on the diagram: α,β,and liquid. • The α phase is a solid solution rich in copper; it has silver as the solute component and an FCC crystal structure.. • The β -phase solid solution also has an FCC structure, but copper is the solute. • At any temperature below line BEG only a limited concentration of silver will dissolve in copper (for the α phase), and similarly for copper in silver (for the β phase).
At temperatures below 779˚C (1434˚F), the solid solubility limit line separating the α and α + βphase regions is termed a solvus line; the boundary AB between the α and α + L fields is the solidus line • At point B maximum solubility is 8.0 wt% Ag at 779˚C (1434˚F) • At point G maximum solubility is 8.8 wt% Cu at 779˚C (1434˚F) • This horizontal line BEG, which is parallel to the composition axis and extends between these maximum solubility positions, may also be considered a solidus line; it represents the lowest temperature at which a liquid phase may exist for any copper–silver alloy that is at equilibrium.
There are also three two-phase regions found for the copper–silver system: α + L , β+L, α + β • As silver is added to copper, the temperature at which the alloys become totally liquid decreases along the liquidus line, line AE; thus, the melting temperature of copper is lowered by silver additions. • The same may be said for silver also • Point E is called an invariant point, which is designated by the composition CE and temperature TE; for the copper–silver system, the values of CE and TE are 71.9 wt% Ag and 779˚C (1434˚F), respectively.
The eutectic reaction • Upon cooling, a liquid phase is transformed into the two solid α and β phases at the temperature TE; the opposite reaction occurs upon heating. This is called a eutectic reaction (eutectic means “easily melted”)
The Eutectic reaction • The horizontal solidus line at TE is called the eutectic isotherm.
The phase diagram has a general shape similar to that for copper–silver. • The eutectic invariant point is located at 61.9 wt% Sn and 183˚C (361˚F).