Download
1 / 34
340 likes | 453 Views
The Biology, Technology and Statistical Modeling of High-throughput Genomics Data. Naomi Altman Dept. of Statistics Penn State U. May 25, 2010. DNA 100 A Statistician’s Simplification. Every cell has the same genetic material, stored in the double helix of DNA.

E N D
The Biology, Technology and Statistical Modeling of High-throughput Genomics Data Naomi Altman Dept. of Statistics Penn State U. May 25, 2010
DNA 100 A Statistician’s Simplification Every cell has the same genetic material, stored in the double helix of DNA. The "backbone" is the support of the ladder. The rungs are "base pairs" . Each pair consists of 2 bound codons which are designed C, G, A, T. These are called base pairs. C binds only to G. A binds only to T. In a diploid population, most cells have 2 copies of each chromosome. http://www.accessexcellence.org/RC/VL/GG/chromosome.html http://www.bioteach.ubc.ca/MolecularBiology/AMonksFlourishingGarden/
DNA replication When the cell divides, the DNA is replicated by breaking the double bond between the base pairs, and rebuilding the double helix by creating a new backbone and new pairs on each strand. The molecules making up the backbone are asymmetric creating a direction along the backbone. One end is called the "3' end". The other end is the "5' end". Duplication always goes from the 5' end to the 3' end. A complex suite of proteins is involved in duplication. http://oak.cats.ohiou.edu /~ballardh/pbio475/Heredity /Heredity.htm
Transcription and Translation • To make a protein: • The DNA unzips • mRNA binds to the exposed codons on the coding (sense) strand - the matching strand is the anti-sense strand • mRNA goes to the ribosome where it binds to amino acids brought to the ribosome by the tRNA • Each set of 3 codons encodes 1 amino acid • The complete linear set of amino acids defines the protein • The protein folds into its active shape http://www.bioteach.ubc.ca/MolecularBiology/AMonksFlourishingGarden/
Transcription • transcription factors bind to the promoter and bind RNA polymerase • DNA strands separate and transcription is initiated • transcription continues in the 3'-5' direction until the stop codons are reached • The completed RNA strand is released for post-processing www.csu.edu.au/faculty/health/biomed/subjects/molbol/basic.htm
Introns and Exons promoter In "higher" organisms, the gene contains noncoding regions, called introns, and coding regions called exons. The introns are spliced out of the mRNA before translation into protein. "Splicing variants" can be formed by the cell selecting combinations of the exons. The resulting spliced strand is the mRNA. We can "predict" exons using statistical algorithms, but the gold standard is that only exons match mRNA sequences Chromosome http://biology.unm.edu/ccouncil/Biology_124/Summaries/T&T.html
DNA 100 A Statistician’s Simplification DNA is complicated stuff. Protein-coding regions are called genes. There are also other functional parts to the DNA, some of which code for RNA and some of which are regulatory regions - i.e. they help control how the coding regions are used - e.g. promoters The supercoiling of the DNA may also control how the coding regions are used. As well, there is a lot of DNA which appears to be "junk" - i.e. to date no function is known. But we keep making new discoveries - e.g. some of the "junk" codes for small RNA pieces that are functional.
DNA 100 A Statistician’s Simplification An allele is a variant of a gene - e.g. "blood type" A, B, O in humans. If a gene has 2 or more alleles, it is said to be polymorphic. A Single Nucleotide Polymorphism (SNP) means that 2 individuals from the same species have a difference in one nucleotide at some location in their DNA. (e.g. a C in one person, and a T in the other). SNPs are very useful for determining the genotype of an organism and for tracing evolution of proteins.
DNA 100 A Statistician’s Simplification A key step in microarray technology is reverse transcription: going from mRNA to DNA with the introns excised. This is called cDNA. At the 5' and 3' ends of the cDNA are the regulatory regions called the "UnTranslated Regions" or UTRs. The 5' UTR is functional and evolves very slowly. The 3' UTR is less functional and hence evolves more rapidly. It can be used to distinguish closely related genes.
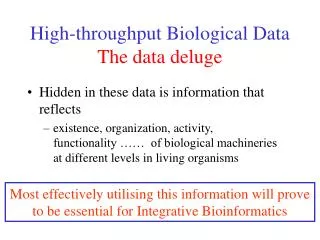
DNA 100 A Statistician’s Simplification DNA persists in the cell, and is the cell's memory device. mRNA and proteins do not persist in the cell and are degraded with components recycled. Degradation is part of cell regulation. Cells degrade both imperfect compounds and those no longer needed. Understanding cellular processes is complicated by our inability to follow the synthesis and degradation processes in single cells - so we are actually seeing the average over many cells which may be at somewhat different stages.
DNA 100 A Statistician’s Simplification The function of each cell is determined by which proteins it produces. Our objective will be to measure either proteins are produced (directly, by measuring and identifying proteins or indirectly by measuring mRNA). It is easier to measure mRNA than protein, but due to degradation, the correlation between mRNA levels and protein levels is imperfect. In fact, in some cases, the mRNA may not actually produce any protein. In some cases we will measure the genomic DNA directly - usually to look for differences among alleles.
PCRPolymerase Chain Reaction PCR allows us to greatly amplify any selected piece of DNA. Selection is done by choice of primer. primer new strand DNA denature (by high temperature) This allows us to detect small quantities of DNA. Labels can be added to the new strands by attaching chemicals to the free C,G,A,T new strand primer
Electrophoresis The PCR product is put through an electrophoresis gel to determine presence/absence of the DNAs targeted by the primer Maryam Ahmed Khan February 14, 2001
PCRPolymerase Chain Reaction PCR is used directly to amplify genes. It is mainly used to detect alleles - i.e. variants of a gene that can be used to e.g. identify individuals (e.g. DNA fingerprinting) identify subpopulations (e.g. tracking ivory poaching) determine which variants are associated with a condition (e.g. drug efficacy)
in the cell mRNA DNA RT-PCRReverse Transcription PCR primer cDNA cDNA cDNA mRNA mRNA primer cDNA RT-PCR is used to identify genes which EXPRESS in the tissue or create a cDNA library
cDNA Library and ESTs A cDNA library is a means of storing specific genes or gene fragments. The library is actually a set of "wells" containing living cells with plasmids containing the cDNA. Often a cDNA library for a tissue is partially sequenced, to obtain Expressed Sequence Tags (ESTs), short pieces of sequenced DNA which can be used to identify which genes are expressed in the tissue. (There is a lot of computation involved in compiling ESTs into gene sequences, which is called assembly.) fig.cox.miami.edu/~cmallery/150/gene/sf16x5.jpg
PCR Methods for Measuring Gene Expression PCR is considered the gold standard for detecting and measuring gene expression. Detection is "simple". A label (radioactive or dye) can be added during the PCR reaction. After several cycles, if the label is bound, then the PCR target must be present.
Quantitative PCR Methods for Measuring Gene Expression Because each cycle of PCR requires the denaturization step the number of PCR cycles is under experimental control. Hence, the quantity of PCR product at the end of some number of cycles can be used to estimate the initial quantity. The estimate is usually improved by also amplifying a "control" product with "known" initial quantity. Quantitative PCR uses only the measured quantity at the final step of a preset number of cycles. Real time PCR uses a label that binds only to double stranded DNA, and measures the quantity at the end of each cycle. This provides a curve giving the label intensity versus the number of cycles, which can be extrapolated back to the initial point. This method is more accurate but much more expensive.
Real Time RT-PCR(from the PSU Nucleic Acid Facility) • A probe is designed to anneal to the target sequence between mRNA and cDNA primers. • The probe is labeled at the 5' end with a reporter fluorochrome and a quencher fluorochrome added at any T position or at the 3' end. • The amount of fluorescence released during the amplification cycle is proportional to the amount of product generated in each cycle. • The software calculates the threshold cycle (CT) for each reaction with which there is a linear relationship to the amount of starting DNA or RNA. • Up to 96 samples are run simultaneously, so the relative fluorescence corresponds to the relative quantity of mRNA initially present
Northern Blot This is another "1-at-a-time" RNA detection method amenable to quantification - the "old" gold standard. http://www.columbia.edu/cu/biology/courses/c2005/handouts/northernforweb.gif
Microarrays A microarray is a glass or plastic slide on which are printed 1000's of single strands of cDNA. RT is used to create single strand labeled cDNA from the mRNA of a tissue. The cDNA binds only to the complementary strand on the slide. Dye intensity for each "spot" is proportional to the concentration of matching cDNA. The intensity is summarized by a scanning microscope, which detects the "spots".
What is a microarray probe? A probe is a spot on an array representing a gene or part of a gene On “cDNA” arrays, the probes are actual pieces of cDNA originally extracted from a cell. We may not know the genetic sequence of a cDNA.
What is a microarray probe? If we know the genetic sequence of the cDNA, we can artificially synthesize a strand of DNA with the same sequence. This is called an oligo(nucleotide). Oligos may be “spotted” on the array like cDNA or may be synthesized on the array by one of several technologies.
cDNA versus Oligos cDNAs have different hybridization properties due to their biochemistry Oligos may be chosen to have similar hybridization properties • and to represent maximally unique parts of genes • or to represent common domains
cDNA versus Oligos cDNAs are maintained in cDNA libraries which are expensive to maintain and may be mislabeled or contaminated. Oligos are synthesized from genomic sequence information which can be subject to error.
Spotted 2-Channel Array Spotted arrays are printed on coated microscope slides. 2 RNA samples are converted to cDNA. Each is labelled with a different dye. http://www.anst.uu.se/frgra677/bilder/micro_method_large.jpg
"Spotted" arrays The spot material may be a cDNA, or an oligo - generally 50-70 codons long. Some commercial arrays use only a single dye. "Spotted" refers to the print technology. Arrays with similar format may have oligos synthesized directly on the array surface.
Affymetrix Array Each gene is represented by a “probe set” Each “probe set” is 16-20 pairs of oligos Each oligo is 25 nucleotides A PM (perfect match) probe matches a strand of cDNA The corresponding MM (mismatch) probe differs from the PM by a change in the central nucleotide The probe pairs are spatially dispersed Control probes are printed
Format of an Affymetrix Array http://cnx.rice.edu/content/m12388/latest/figE.JPG
Heuristics for “Probe Sets” MM probe is supposed to control for: Variation in chemical composition Abundance of cross-hybridizing fragments from other genes By combining PM and MM information from many probes, gene to gene differences should be minimized. These arrays are more quantitative than other types of microarrays.
Microarrays for Gene Expression Whichever technology is used, an intensity value is obtained for every probe from every sample. Generally values are comparative - i.e. does this probe express more highly in melanoma than in a normal skin cell. The data are very noisy. A lot of effort has gone into data-cleaning methods which are generally called "normalization".
Microarrays for Gene Expression Microarrays are "genomic" - 6000 - 40,000 genes may be on a single array. Microarrays have other uses - e.g. tiling arrays cover the entire genome - SNP arrays have 2 variants of many SNPs - promoter arrays have upstream sequence We will focus on gene expression arrays but most of what we discuss will be useful for all "omic" level data.
Measuring Gene Expression Microarrays are very expensive (on a per array basis) and somewhat noisy, have broad coverage (which makes them cheap on a per gene basis). Real time PCR and Northern blots are more accurate (maybe) but are "single gene" methods.
Measuring Gene Expression Microarrays are used to obtain broad coverage of the genome. Real time PCR or Northern Blots are often used to verify the results for a few genes, or for some low-expression genes.