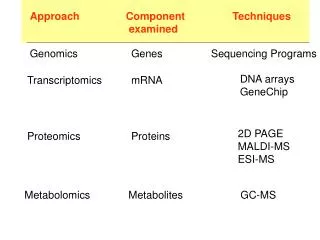
Statistical Genomics
Discover advanced R programming techniques for statistical genomics with a focus on data analysis, modeling, and decision-making strategies. Learn to simulate phenotypes, implement functions, and validate models using R.

Statistical Genomics
E N D
Presentation Transcript
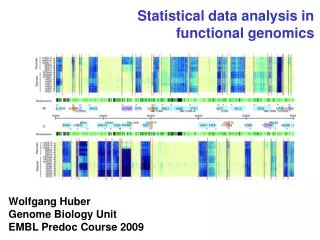
Statistical Genomics Lecture 2: Programming in R Zhiwu Zhang Washington State University
Current and future needs "By 2018, the US alone could face a shortage of 1.5 million managers and analysts with the know-how to investigate big data to make effective decisions" -McKinsey Global Institute, 2014 report
R You Ready for R? http://www.analyticsvidhya.com/blog/2014/03/sas-vs-vs-python-tool-learn/
R You Ready for R? http://www.analyticsvidhya.com/blog/2014/03/sas-vs-vs-python-tool-learn/
Robert Gentleman and Ross Ihaka Start with S in 1996 Open source Open packages
IF if(distribution=="norm") {addeffect=rnorm(NQTN,0,1) }else {addeffect=alpha^(1:NQTN)}
Function phenoSimu=function(X,h2,alpha,NQTN,distibution,seed){ Define function here }
List return(list(addeffect = addeffect, y=y, add = effect, residual = residual, QTN.position=QTN.position, SNPQ=SNPQ))
Loop myNQTL=c(3,10,20,50,100,200) for(i in 1:length(myNQTL)) { myv=validation(n=n,m=m,y=myps$y,X=X,residual=myps$residual,effect=myps$add,QTN.position=myps$QTN.position,addeffect=myps$addeffect,NQTL=myNQTL[i]) print(c(i,myNQTL[i],myv$fit,myv$accuracy)) }
Highlight • File input and output • R objects • numeric vs. character • vector, matrix, and data.frame, list • myF$p • IF and Loop • Apply • Graph • Function