Download
1 / 28
300 likes | 387 Views
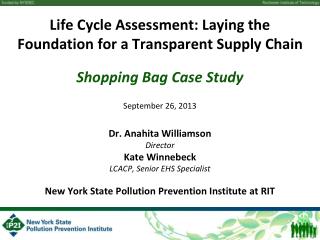
Learn about an ongoing project focusing on the sustainability of cheese plants in Wisconsin, aiming to identify environmental impact "hot spots" and innovative methods for improvement. The project includes surveys, modeling, audits, and outreach programs.

E N D
Life Cycle Assessment for Cheese Plants FX Milani UW-Madison Wisconsin Dairy Products Association September 28, 2010
FIL/IDF, UN-FAO dairy report World dairy contributes 4% of all manmade green house gases
Wisconsin cheese and whey • Who: Rural development is VERY interested in the contribution of cheese/dairy manufacturing • What: Concern about sustainability issues, want to find “hot spots” and new potential returns
Wisconsin cheese and whey • Where: Wisconsin based manufacturing • When: This year and next spring, beyond? • Why: Ultimately, dairy manufacturing is vital • How: Survey work to get baseline concerns and data, model potential ideas, investigate best ideas
The projects: 3 this year • Sustain Metrics: • UW Food Science, CDR,UW Biological Systems Engineering • F. Milani, D. Reinemann, D. Sommer, students • Modeling, Survey audits, Outreach program, Reports • Whey Disposal: • UW Food Science, CDR, Industrial Partners • F. Milani, M. Molitor, D. Sommer, Contractors • Survey audits, Whey/permeate data, Waste water data, Reports/potential • Sustainability Outreach: • UW Food Science, Biological Systems Engineering • F. Milani, A. Newenhouse • Short course, Involvement with 2011 WCMA LaCrosse, Outreach materials, Bus trips
Specific information to collect • Energy use: gas, electric, wood, LP, etc • Transportation use • Refrigerant use • Raw material, chemical use • Packaging use • Water use, wastewater generated • Pounds and types of cheese produced
Cheese Yield 10%, ~50% solids loss to whey Percent milk constituents
Milk is high in phosphorous USDA Handbook 8
Cheese P loss to whey (50-90%) (Wendorff & Matzke, 1993)
The 4 F’s of whey High Value $ FOOD Feed Fuel $ Fertilizer Low Value
Options for whey • Sell to aggregate processor • Land spread • Concentrate and sell (wet or dry) • UF concentrate, sell wet protein • Permeate: sell wet or land spread • UF concentrate, sell dry protein • Permeate: sell dry lactose, dry/landspd wet DLP • (note: lactose market is very volatile) • UF concentrate, sell wet protein • Permeate: biogas, dump minerals
Average Wisconsin cheese plant • 44.7 M pound cheddar cheese annually • 28.8 M pounds sweet whey equivalent • 447 M pounds milk (1.2 M pounds per day) • 116 k gal per day water use, high vary • 230 k gal per day wastewater flow, med vary • 14,355 kWhr per day electric • 6568 therms per day natural gas • 459,801 pounds of caustic annual use Citations listed at end of presentation
Wastewater and Carbon Footprint Short Courses, November 9-11 http://www.foodsci.wisc.edu http://www.cdr.wisc.edu
Citations for average cheese plant • Cheese production: http:www.nass.usda.gov/Statistics_by_State/Wisconsin/Publications/Annual_Statistical_Bulletin/annbull_2008.pdf • Whey conversion: USDA Handbook 8 • Milk Input: Van Slyke equation for cheddar cheese • Water use: Fietz et al. Int. J. LCA 12(2) 109-17, 2007 • Wastewater output: Danalewich, et al. Wat. Res. 32(12) 3555-68, 1998 • Electric and natural gas use: C. Ling et al. USDA report, 2004 • Sodium Hydroxide use: Fernadez, et al. J. Food Eng 97, 319-28, 2010
How much energy is in permeate? • Yield of pure carbohydrate is 0.38 cubic meter methane per kg lactose • 1 kg lactose is 13,300 BTU, or 0.133 therm • 1 therm is $0.475 • 1 kg lactose is $0.063, or $0.029 per pound • Current market lactose is $0.29-0.35, less drying cost at about $0.19, plus operational 3-12 cents, profitable now, but… • Wet permeate is 4.5% lactose
Carbon credits with lactose • 1 kg lactose produces 0.38 cubic meters methane, and 0.74 kg CO2 • 2685 kg of lactose produces mton CO2 • Assume EU trading at $15 per mton, get additional $0.0055 per kg lactose ($0.0025 per pound) • $50,287 per year new revenue • Consumer milk is burdened with1.2 CO2 per kg milk. Milk contains 45 g lactose, potential 0.033 kg CO2 / kg milk carbon credit from lactose
Whey processing steps Drained Whey Fines Saver Cheese Fines Separator Whey Cream Clarified whey Pasteurization RO Evaporator Condensed Whey To Processor
Whey Processing steps Condensed Whey Crystallizer Spray Dryer Dry Sweet Whey
Benefits to landspreading • Nutrient recycling • Residual fertility • Soil physical properties • Cost effectiveness • Pollution reduction
Issues with landspreading • Nitrogen content • Salt concentration • Soil oxygen levels • Odors • Soil limitations • Seasonal limitations (injection)