1 / 0

Environmental Life Cycle Assessment

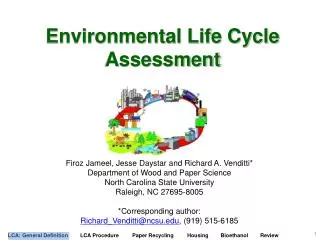
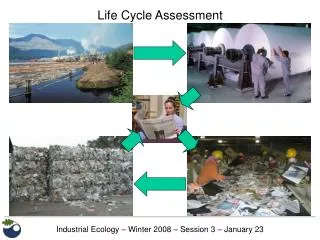
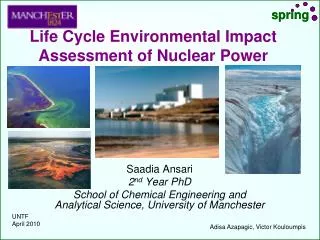
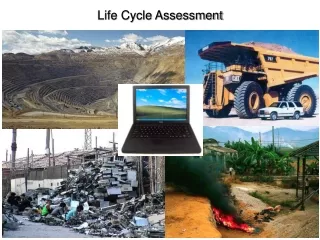
Environmental Life Cycle Assessment . Firoz Jameel, Jesse Daystar and Richard A. Venditti* Department of Wood and Paper Science North Carolina State University Raleigh, NC 27695-8005 *Corresponding author: Richard_Venditti@ncsu.edu , (919) 515-6185. Introduction.

kanoa
Download Presentation

Environmental Life Cycle Assessment

An Image/Link below is provided (as is) to download presentation Download Policy: Content on the Website is provided to you AS IS for your information and personal use and may not be sold / licensed / shared on other websites without getting consent from its author. Content is provided to you AS IS for your information and personal use only. Download presentation by click this link. While downloading, if for some reason you are not able to download a presentation, the publisher may have deleted the file from their server. During download, if you can't get a presentation, the file might be deleted by the publisher.

E N D

Presentation Transcript


  1. Environmental Life Cycle Assessment

    Firoz Jameel, Jesse Daystar and Richard A. Venditti* Department of Wood and Paper Science North Carolina State University Raleigh, NC 27695-8005 *Corresponding author: Richard_Venditti@ncsu.edu, (919) 515-6185
  2. Introduction Learning Objectives of this section: Be able to define a LCA To understand an LCA’s importance To identify important aspects of an LCA
  3. Sustainability? How do we supply societies needs without harming the environment or future generations’ ability to meet their needs? We have many options to meet our demands. How to choose the “best” option? Life cycle assessment helps to inform our choices.
  4. What is a Life Cycle Assessment ? Life Cycle Assessment (LCA) is a tool to assess the potential environmental impacts of products, systems, or services at all stages in their life cycle [ISO 14001:2004]. Types of LCA Cradle to Gate: raw materials to finished good (no use or end life considerations) Cradle to Grave: Considers everything from harvesting materials to the disposal of the finished goods
  5. Energy Energy Energy Energy Energy Production Transportation Use Disposal Recycle Waste Waste Waste Waste Waste Emissions to air and water Emissions to air and water Emissions to air and water Emissions to air and water Example LCA Process Recycled Materials Raw Materials
  6. Why is an LCA Important? Helps ensure compliance with government regulations Helps decrease the environmental impact of a given product Identifies ways to improve sustainability Identifies ways to “green” all aspects of product’s life Can reshape company strategy Can help marketing Can reshape company image Develop product advantage of competition
  7. Important Aspects of Life Cycle Assessment Goal and Scope Definition Interpretation Inventory Analysis Impact Assessment
  8. Goal and Scope Definition Learning Objectives of this section: To understand how to properly define the goals of an LCA To understand how to establish the boundaries of an LCA
  9. Defining Goals Should state the intent of the study Intended application Intended use Intended audience Should also include reason for the study
  10. Defining Scope Define functional unit of product Help establish system boundaries for the LCA Determine data collection methods
  11. Goal and Scope Definition: Your Turn Exercise: Define the goal and scope of an LCA designed to study the life cycle of a peanut butter and jelly sandwich
  12. Important Aspects of Life Cycle Assessment Goal and Scope Definition Interpretation Inventory Analysis Impact Assessment
  13. Inventory Analysis Learning Objectives of this section: To understand what needs to be included in an inventory analysis To understand the steps and processes included in an inventory analysis
  14. Energy Energy Energy Energy Energy Production Transportation Use Disposal Recycle Waste Waste Waste Waste Waste Emissions to air and water Emissions to air and water Emissions to air and water Emissions to air and water Inventory Analysis: What Needs to be Included? Recycled Materials Raw Materials All relevant stages of the life of a product Raw Materials/Energy Needs Manufacturing Transportation, Storage & Distribution Use, reuse, and maintenance Recycle & Waste Management
  15. Inventory Analysis: Setup In an LCA, it is necessary to standardize all units of measure For measuring energy use Use mega joules (MJ) to measure potential energy from non-renewable sources Use kilowatt hours (kW-h) to measure electrical energy For measuring waste materials and emissions Use tons to measure airborne emissions and solid waste Use gallons or liters to measure waterborne emissions Create a standard basis for comparison Example: per product piece, or per kg of product Establish rigid boundaries for the Inventory Analysis
  16. Inventory Analysis: Raw Materials & Energy Needs Two types of Raw Materials Primary- first use material Secondary- second use material (recycled) Analyze energy requirements Energy required to harvest the raw materials Energy required to convert the raw materials to the finished product Look at materials associated with maintaining the raw materials Define and quantify emissions and wastes associated with the production of the raw materials
  17. Inventory Analysis: Manufacturing Manufacturing should take into account the following Tools Molds, machinery, etc. Processes Waste Material Packaging All emissions produced Energy used
  18. Inventory Analysis: Transportation, Storage and Distribution Transportation Equipment used to move goods Airplanes, trucks, trains, etc Distance Storage and Distribution Warehouses Wholesalers Retailers
  19. motor oil, oil & air filter, hoses, tires, etc. CO2, H2O spent motor oil, oil & air filter, hoses, tires, etc. spare parts for newer cars gasoline Inventory Analysis: Use, Reuse and Maintenance Inventory or materials and energy required to fully utilize the product Use Energy required for normal use Emissions from normal use of the product Reuse Reusing product for the intended purpose Reusing the product in a different manner Maintenance Replacement parts Maintenance fluids Oils, grease, polish, paint, etc
  20. Inventory Analysis: Recycle and Waste Management Recycle Salvage of useful parts Production of secondary raw materials Waste Management Disposal of non-salvageable product Landfills, hazardous waste dumps, etc Incineration Composting
  21. Inventory Analysis: Types of Pollution Three main types of pollution Airborne emissions Carbon dioxide, sulfur dioxide, etc Waterborne emissions Wastewater, untreated chemicals, etc Solid waste Scrap materials, process waste, etc
  22. Inventory Analysis: ISO Standard Overall steps for LCA are defined in ISO 14044 Steps for conducting an inventory analysis are explained in ISO 14041 Steps involved Preparing for data collection Data collection Validation of data Relating data to unit process Relating data to functional unit and data aggregation Refining system boundaries
  23. Inventory Analysis: Example Example product: copy paper Raw Materials Wood, water, various chemicals, energy Chemical and Energy Recovery Manufacturing Machinery, processes, packaging material Transportation and Distribution Storage of paper in warehouses, selling of it via wholesalers/retailers Use Products associated with the use of copy paper Disposal Waste products, Recycling, landfilling Energy recovery
  24. Inventory Analysis: Your Turn Exercise: Conduct an Inventory Analysis of a Peanut Butter and Jelly Sandwich:
  25. Important Aspects of Life Cycle Assessment Goal and Scope Definition Interpretation Inventory Analysis Impact Assessment
  26. Impact Assessment Definition: Impact assessment is the process of identifying the future consequences of a current or proposed action. (cbd.int/impact) Learning Objectives of this section: To understand what needs to be included in an impact assessment To identify the usual steps and processes included in an impact assessment
  27. Impact Assessment: ISO Standard Overall steps for LCA are defined in ISO 14044 Protocol for an impact assessment is explained in ISO 14042 Mandatory elements for an impact assessment Selection of impact categories Assignment of inventory analysis results Calculation of category indicator results (characterization) Optional elements Calculation of the magnitude of category indicators (normalization) Grouping Weighting
  28. Impact Assessment: What Needs to be Included? All environmental impacts associated with the production, use and disposal of the product Ecological Systems Degradation Resource Depletion Human Health & Welfare
  29. Impact Assessment: Ecological Systems Degradation Chemical Toxicity Physical Habitat Loss Biological Foreign Species Ecological system : An ecosystem is a natural unit consisting of all plants, animals and micro-organisms (biotic factors) in an area functioning together with all of the non-living physical (abiotic) factors of the environment. (Christopherson, 1996) Invasive species-Kudzu
  30. Cl Cl C Cl F Freon 11 Impact Assessment: Ecological Systems Degradation – Risks Assessment Ecological Response to Indicator Intensity of Potential Effect Time Scale of Recovery Spatial Scale Transport Media There is no global agreement in weighting risks Hole in ozone layer caused by Freon
  31. Impact Assessment: Resource Depletion Resources are either renewable or non-renewable Renewable Hydroelectric energy, biomass products, most crops, etc Non-renewable Oil, minerals, metals, etc Ideally want to recycle as many non-renewable based components as possible
  32. Impact Assessment: Human Health & Welfare Analyze impact of product on human health Diseases that could potentially be caused by using the product Cigarettes: Cancer Diseases that can be caused by wastes produced by the product or the production of it Solid particulates emitted in stack gasses for a coal burning plant: Cancer Products that harm human health can have a negative impact on a company’s image
  33. Environmental Indices IGW – global warming ISF – smog formation IOD – ozone depletion IAR – acid rain IINH – human inhalation IING – ingestion toxicity ICINH -human carcinogenic inhalation ICING – carcinogenic ingestion toxicity IFT – fish toxicity
  34. Impact Assessment: Example Example product: copy paper Ecological systems degradation Impact of cutting down trees Impact of discharged chemicals in the water waste on the water quality Resource depletion Resource is renewable because it is trees, but it is not rapidly replaceable The paper is easily recyclable, reducing primary raw material needed For energy, mostly self sufficient Human health and welfare Impact of chemicals used on human health Impact of stack emissions from chemical and energy recovery on health of population around mill
  35. Impact Assessment: Your Turn Exercise: Conduct the impact assessment for a Peanut Butter and Jelly Sandwich
  36. Important Aspects of Life Cycle Assessment Goal and Scope Definition Interpretation Inventory Analysis Impact Assessment
  37. Interpretation Learning Objectives of this section: To be able to identify what needs to be included in an interpretation To understand how this step can be best used
  38. Interpretation: ISO Standard Overall steps for LCA are defined in ISO 14044 Proper protocol for interpretation is explained in ISO 14043 Aside from presenting results, the interpretation should conduct these checks Completeness check Sensitivity check Consistency check Include conclusions and recommendations
  39. Original product After Improvement Analysis Interpretation: The Feedback Mechanism Analyze opportunities to reduce or mitigate the environmental impact throughout the whole life cycle of a product, process or activity. Analysis may include both quantitative and qualitative measures of improvement Changes in product design Changes in raw material usage Changes in industrial processes
  40. Interpretation: Example Example product: copy paper Changes in product design Determining potential areas of improvement for the product design Lighter weight paper? Lower brightness paper? Changes in raw materials Using more secondary materials in place of primary materials Use alternative chemicals Changes in industrial process Changing from Acid to Alkaline papermaking Changing from chlorine containing bleaching processes to chlorine free bleaching processes
  41. Interpretation: Your Turn Exercise: Interpret the results of your LCA and present them to the group
  42. Carbon Footprint Model for Bleached Pulp and Paper Products Trevor H. Treasure, Jesse S. Daystar and Richard A. Venditti* Department of Wood and Paper Science North Carolina State University Raleigh, NC 27695-8005 *Corresponding author: Richard_Venditti@ncsu.edu, (919) 515-6185
  43. Waste PaperWhat do we do with it all? Paper More than 700 lb/person annual paper consumption in the USA 40% of all municipal waste is paper What should be done with waste paper?
  44. Life Cycle Assessment-Recycling Paper Products Goal and Scope Definition Interpretation Inventory Analysis Impact Assessment
  45. Goals To compare the carbon footprint of three waste management scenarios for copy paper 1. Landfilling2. Incineration3. Recycling To perform a systematic and quantitative evaluation of these three waste management options To provide a tool for consumers and waste management personnel for determining the best waste management practices Goal and Scope Definition
  46. Scope

    Goal and Scope Definition Three waste management scenarios considered. Landfilling Incinerating Recycling This study will not consider the effect of recycling on the value of wood or its consequences on the wood market A full impact assessment will not be performed This analysis only accounts for carbon emissions Other significant pollutants are emitted but are not accounted for in this study, example heavy metals
  47. Assumptions 1 of 2

    Increased recycle production has no effect on tree production Methane emissions from land fills have been converted to carbon dioxide equivalents using a ratio of 21:1 (IPCC 1995, table 4, pg. 26) Avoided CO2 releases based on fuel mix for national electricity grid Heating value of copy paper  6213 BTU/lb (PTF White Paper No.3) Net heating value of methane 21,433 BTU/lb (engineeringtoolbox.com)
  48. Assumptions 2 of 2

    Responsible silviculture  replant to harvest ratio equals 1:1 Carbon sequestration based on wood makeup and weight percent carbon of cellulose, hemicelluloses, and lignin All mills are considered to be average in energy and production efficiency Office paper is assumed to be 20% inert, inorganic filler material Office paper fibers: 20% softwood and 80% hardwood
  49. Life Cycle Assessment -recycling paper products Goal and Scope Definition Interpretation Inventory Analysis Impact Assessment
  50. Raw Material Composition

    Source: Dr. Dimitris S. Argyropoulos, course pack for WPS 332
  51. Carbon Equivalents

    12 g carbon/mol CO2 Tons =Carbon Equivalents 44 g CO2/mol Carbon Equivalents Conversion ` 12 g carbon/mol Methane Tons =Carbon Equivalents 16 g CH4/mol Methane Tons combusted 12 g carbon/mol =Carbon Equivalents 16 g CH4/mol 12+(4x1)=16
  52. Process Flow Diagram 1 of 2Virgin Production + Landfilling Energy/fuel CO2 Emissions Energy/fuel CO2 Emissions Filler Energy/fuel CO2 Emissions
  53. Process Flow Diagram 1 of 2 Energy/fuel=0 CO2 Emissions=0 CO2 Emissions Energy/fuel Energy/fuel CO2 Emissions Methane Emissions Carbon Stored in landfill Electricity production
  54. ProcessConversions 1 ton methane is equal to 21 ton CO2 equivalents
  55. Virgin Production + Landfill Energy Requirements and Carbon Emissions Negative values represent either energy created or carbon sequestered
  56. Process Flow Diagram 1 of 2Virgin Production + Incineration CO2 Emissions Energy/fuel Energy/fuel CO2 Emissions Energy/fuel CO2 Emissions
  57. Process Flow Diagram 2 of 2 Energy/fuel=0 CO2 Emissions=0 Energy/fuel CO2 Emissions Energy/fuel CO2 Emissions CO2 Emissions Methane Emissions Carbon
  58. Virgin Production + Incineration Calculations Incinerator carbon equivalents emissions= Virgin paper mill yield % Fiber in paper tons carbon in wood 6213 BTU 2000 lbs 1 MMBTU tons paper tons virgin production lb paper ton 1,000,000 BTU Energy produced from paper combustion= White paper #3
  59. Virgin Production + IncinerateEnergy Requirements and Carbon Emissions Negative values represent either energy created or carbon sequestered
  60. Process Flow Diagram 1 of 3Recycled Production + Recycling Energy/fuel CO2 Emissions Energy/fuel CO2 Emissions Energy/fuel CO2 Emissions Energy/fuel CO2 Emissions Filler Rejects to waste treatment
  61. Process Flow Diagram 2 of 3Recycled Production + Recycling Energy/fuel CO2 Emissions Carbon sequestered in product Energy/fuel=0 Possible decrease in demand NOTE: Tree growth loss is assumed to be zero for this study Forest used in more profitable ways such as construction
  62. Process Flow Diagram 3 of 3Recycled Production + Recycling Energy/fuel CO2 Emissions CO2 Emissions Methane Emissions
  63. Calculations Recycled Production + Recycle Carbon sequestered in use= tons carbon in wood Virgin paper mill yield % Tons recycled paper Tons virgin production Carbon sequestered in landfill= Paper Task Force: White Papers tons organics (1-.382) Filler content Tons organics in sludge= Tons recycled paper % Filler Total sludge
  64. Recycled Production + RecycleEnergy Requirements and Carbon Emissions Negative values represent either energy created or carbon sequestered
  65. Unit Process Emissions
  66. % Difference From Landfilling
  67. Sensitivity Analysis Virgin Production + Landfill Base case value of .812 carbon equivalents per ton of production Landfill methane recovery rate has the largest impact on carbon emissions Methane is 21 times more harmful than CO2
  68. Sensitivity Analysis Virgin Production +Incinerate Base case value of .866 carbon equivalents per ton of production The carbon emissions of this waste management practice are not greatly impacted by these sensitivities
  69. Sensitivity Analysis Recycled Production + Recycling Base case value of .141 carbon equivalents per ton of production Landfill methane recovery rate has the largest impact on carbon emissions Transportation emissions significantly impacted the total
  70. Interpretation The Recycling scenario has the smallest carbon footprint Landfill carbon footprint is highly dependent on the methane recovery rate Increased recycling may reduce green house gas emissions Increased recycling may impact the wood market These impacts are outside the scope of this study
  71. Interpretation: Environmental Improvement Opportunities Potential Process Improvement Increase methane recovery in landfills Decrease transportation of products and raw materials Increase paper production efficiency Energy Use renewable transportation fuels Utilize renewable electrical power Increase energy efficiency in production process
  72. Wood for Building HousesAn Example of LCA

    Adam Taylor Assistant ProfessorForestry, Wildlife & Fisheries203 Forestry Products, 2506 Jacob DriveKnoxville, TN  37996AdamTaylor@utk.eduPhone: 865-946-1125
  73. What Do You Think? http://www.ussi.ca/residential_steel.html
  74. Acknowledgment All of the information in this presentation is based on work conducted by CORRIM http://www.corrim.org/
  75. CORRIM Consortium for Research on Renewable Industrial Materials Aims to provide a database of information for quantifying the environmental impacts and economic costs of building materials
  76. Motivation The environmental consequences of changes in forest management, product manufacturing, and construction are poorly understood Lack of up-to-date, scientifically sound, product life-cycle data in the United States, particularly life-cycle data regarding wood and bio-based products For example, concerns about the sustainability of present forest practices have lead to changes in forest harvesting in the US. As a result, the US wood products sector has lost a substantial market share to non-wood substitutes and foreign suppliers
  77. Mission: To create… A consistent database to evaluate the environmental performance of wood and alternative materials from resource regeneration or extraction to end use and disposal, i.e., from "cradle to grave. (Figure 1). A framework for evaluating life-cycle environmental and economic impacts. Source data for many users, including resource managers, manufacturers, architects, engineers, environmental protection and energy analysts, and policy specialists. An organizational framework to obtain the best science and peer review
  78. Membership in CORRIM Research Institutions and Voting Board Members University of Washington Oregon State University University of Minnesota University of Idaho FORINTEK, Canada Virginia Tech North Carolina State University Purdue University University of Maine Penn State University State University of New York APA, The Engineered Wood Association Western Wood Products Association Composite Panel Association Research Foundation Washington State University Louisiana State University Mississippi State University
  79. Life Cycle Assessment -applied to building products Goal and Scope Definition Interpretation Inventory Analysis Impact Assessment
  80. Goals To develop a database and modeling system for environmental performance measurements associated with materials use To respond to specific questions and issues related to environmental performance and the cost effectiveness of alternative management and technology strategies.
  81. Scope

    Houses built with different materials Minneapolis (cold climate) - wood & steel Atlanta (warm climate) - wood & concrete
  82. Minneapolis House – Front Elevation
  83. Design Differences: Minneapolis Full Basement 2062 sq.ft. 2 story
  84. Design Differences: Atlanta 2153 sq.ft. 1 story On-Slab
  85. Life Cycle Assessment -applied to building products Goal and Scope Definition Interpretation Inventory Analysis Impact Assessment
  86. Life Cycle Inventory Analysis for Wood Building Materials Forest Management (Regeneration) (Transportation) EMISSIONS Raw Material Acquisition(Harvest) EFFLUENTS (Transportation) MATERIALS SOLIDWASTES Product Manufacturing (Transportation) ENERGY OTHERRELEASES Building Construction WATER (Transportation) Use/Maintenance PRODUCTS (Transportation) COPRODUCTS Recycle/Waste Management (Transportation)
  87. System Boundaries Forest Resources: NW and SE(25-100+ years) Harvesting( < 1 Year) logs NW and SE Processing( < 1 Year) lumber SE and NW (green and dry) plywood NW and SE OSB SE Glulam, LVL, I-Joists Construction( < 1 Year) wood and steel Minneapolis (cold) wood and concrete Atlanta (warm) Use and Maintenance(40 – 100+ years) Disposal(< 1 Year) “Cradle” “Gate to Gate” “Grave”
  88. Regeneration to waste disposal Primary source for wood data Secondary source for non wood data (ATHENA) Boundaries: Regional product detail Multi-material detail Environmental Performance: Air, water, toxic substances, energy, carbon, waste mid-point parameters for human health risk Strategic Research Plan (1998) Study Guideline (2000) – ISO consistent Protocol:
  89. Building Product LCI’s For building products for lumber, plywood, OSB, LVL, glulam, I-joists, trusses Unit process descriptions (saw, dry, plane etc.) Mill surveys at unit process level Non-wood inputs (energy by source, raw materials) Emissions and solid waste outputs Yields, flows (co-products) and mass balances Unit factor estimates (raw materials, air, water, and solid emissions, energy, carbon) before and after impacts from purchased energy and transportation
  90. U.S. LCI Database Project ATHENA & NREL Publicly available info on common materials, products and processes Could lead to “eco-impact labels” similar to food labeling
  91. Life-Cycle Inventory results 1.0 MSF 3/8-in. basis plywood production INPUTS OUTPUTS Per MSF Per MSF Materials Units Materials Units 3/8-in. basis 3/8-in. basis Bark 6.56E+01 ft.3 1.31E+01 Wood/resin 7.75E+00 lb. 1.89E+03 Bark waste lb. Roundwood (log) 2.09E+01 lb. 1.59E+01 Bark ash lb. Total lb. Phenol-formaldehyde 9.91E+02 a lb. 8.90E+00 Products Plywood lb. lb. 1.11E+00 Extender and fillers 4.25E+02 Co-products lb. lb. 3.30E-01 4.62E+01 Catalyst a Wood chips lb. 3.10E+01 lb. 1.98E+02 Soda ash a Peeler core lb. Veneer downfall 3.44E+00 Green clippings lb. lb. 6.81E+00 Bark b 1.07E+02 lb. 9.63E+00 lb. 1.51E+01 Dry veneer Panel trim lb. Solid dry veneer 6.68E+01 Sawdust lb. Green veneer 6.89E+02 lb. Electrical energy Total lb. 1.12E-02 kWh 1.39E+02 Electricity Air emissions 4.80E-03 b Acetaldehyde lb. Fuel for energy 4.95E-07 Acetone lb. lb. 3.83E+02 b 4.77E-04 Hog fuel (produced) Acrolein lb. 1.91E+00 lb. 3.40E+01 Benzene lb. Hog fuel (purchased) 2.78E+02 CO lb. lb. 5.00E-01 Wood waste CO 2 non-fossil 2.78E+02 CO 2 fossil lb. gal. 3.59E-01 2.08E-01 Liquid propane gas lb. 1.80E-02 ft.3 1.63E+02 Dust (PM10) lb. Natural gas 1.28E-01 Formaldehyde lb. gal. 3.95E-01 2.34E-01 Diesel Methanol lb. Organic substances 2.20E-02 NO x lb. 3.47E-01 a These materials were excluded based on the 2% rule. lb. 8.27E-03 b Bark and hogged fuel are wet weights whereas Particulates lb. 7.74E-04 all other wood materials are oven dry weights; Phenol lb. 1.01E-01 bark weight is included in the “hog fuel (produced)” weight. SO 2 lb. VOC lb. 6.26E-01 SO x lb.
  92. Life Cycle Assessment -applied to building products Goal and Scope Definition Interpretation Inventory Analysis Impact Assessment
  93. An example of LCI comparisons: Minneapolis Steel minus Wood Extraction (primary materials in kg)
  94. An example of LCI comparisons : Atlanta Concrete minus Wood Extraction (primary materials in kg)
  95. GWP: Minneapolis and Atlanta
  96. Summary - Minneapolis Building
  97. Summary - Atlanta Building
  98. Other Studies – Same Results 1992 New Zealand study Wood office building 55% of energy/70% carbon versus concrete Steel wall 4x energy of wood wall 1992, 1993 Cdn studies Wood 1/3 energy and CO2 versus steel and concrete Wood consistently lower emissions and less energy
  99. Life Cycle Assessment -applied to building products Goal and Scope Definition Interpretation Inventory Analysis Impact Assessment
  100. Not All Energy is Equal
  101. Emissions to Water: Minneapolis
  102. Emissions to Water: Minneapolis On Equal Health Risk Basis
  103. Energy in Building Life Cycle
  104. Carbon Dynamics vs. Steady State LCI provides a cross sectional profile of all processes -- a steady state analysis Tracking carbon pools over time offers a dynamic alternative for a more financial cost/benefit perspective
  105. Concrete frame/wood frame Atlanta Steel frame/wood frame Minneapolis
  106. Carbon In Forest Pools FIA data on old stands No harvest Harvest rotation years
  107. Carbon Dynamics Need to be Considered Averages over time intervals
  108. Carbon Emissions in Representative Building Life Cycle Stages
  109. Interpretation: Environmental Improvement Opportunities Redesign the house use less fossil-intensive products (wood is good!) reduce energy use (both active and passive) improve durability to increase useful life Improve the product greater use of biofuel engineered products for greater raw materials efficiency increase process efficiencies, especially in drying pollution control improvements increase product durability Reduce, reuse and recycle demolition wastes
  110. LCA Strengths & Weaknesses Con Dependent on quality of LCI LCI difficult to establish Steady state Resources change Time value of money Pro System wide Quality and objectivity Multiple impact factors
  111. Life Cycle Assessments Biomass to Ethanol from Different Regional feedstocks Jesse Daystar, Richard Venditti*Based on work of Kemppainen and Shonnard Department of Wood and Paper Science North Carolina State University Raleigh, NC 27695-8005 *Corresponding author: Richard_Venditti@ncsu.edu, (919) 515-6185
  112. Biomass to Ethanol U.S. Department of Agriculture Biomass Estimation Estimated 3.56 million dry tons on a sustainable basis in U.S. per day2 U.S. Oil Consumption 868.6 million gallons/day1 Potential ethanol production 9.58 million gallons per day of oil equivalents2
  113. Life Cycle Assessment -applied to cellulosic ethanol Goal and Scope Definition Interpretation Inventory Analysis Impact Assessment
  114. Goals To compare the environmental impacts of two processes that utilize different regional cellulosic feedstocks to produce ethanol. Yellow Poplar regional to Michigan Recycled Newsprint
  115. Scope Production Gate Cradle "Cradle to gate” Acquisition of raw material through production of ethanol Different from “cradle to grave” Will not investigate the impacts of the use of ethanol Why Cradle to Gate? End use of ethanol for both alternatives is identical
  116. Life Cycle Assessment -applied to cellulosic ethanol Goal and Scope Definition Interpretation Inventory Analysis Impact Assessment
  117. Simulation and ModelingYellow Poplar Pre-manufacturing diesel & gasoline Raw material & energy diesel electricity Transportation Felling & Skidding Chipping Ethanol Production Boustead Model Emissions Factors & EFRAT ASPEN Simulation & EFRAT
  118. Simulation and ModelingNews Print Pre-manufacturing diesel & gasoline Raw material & energy diesel electricity Transportation Collection & Sorting Pulping Ethanol Production Boustead Model Emissions Factors & EFRAT ASPEN Simulation & EFRAT
  119. Feedstock Composition
  120. Boustead Model Standard Data Sets Custom Data Sets Transportation distances, materials used, utilities Life Cycle Inventory Results
  121. NREL Process Modeling Modeling software ASPEN Developed by M.I.T. and the Department of Energy Process modeling Process optimization Life Cycle Inventory Results
  122. Pre-manufacturing Energy Usage
  123. Simplified Process Flow Ammonia, Lime, Acid Feedstock Chips Feed Handling Sugars Pretreatment (Detoxification) Hydrolysis & Fermentation Recycle water Recycle Water Nutrients Air Enzyme Waste Water Treatment (Solid Separation) Cellulase Steam Product & Water Recovery Excess Condensate Still Solids Ethanol Utilities Waste Combustion Ethanol Storage Electricity Steam
  124. Detailed Process Flow
  125. Energy Balance Upper Michigan Timber Process loses 9.7% of total energy through processes inefficiencies 30% of total energy consumed in cooling water system This is higher than newsprint due to higher boiler throughput Energy balance has an accuracy of 2%
  126. Energy Balance News Print 2.2% more energy leaves with ethanol product for newsprint compared to timber process Energy balance has an accuracy of 0.3%
  127. Process Air Emissions
  128. LCA Progress So Far ☐ So far we have Defined scope Defined goal/objective Performed inventory analysis Performed energy balance Next Impact assessment LCA interpretation LCA improvement   ☐
  129. Life Cycle Assessment -applied to cellulosic ethanol Goal and Scope Definition Interpretation Inventory Analysis Impact Assessment
  130. Impact Modeling Environmental Fate and Risk Assessment Tool (EFRAT) Developed by Michigan Technological Institute Department of Chemical Engineering Model basis simulation output preprogrammed chemical and soil properties Evaluates 8 environmental indices Safety factors Economic factors
  131. Environmental Indices IGW – global warming ISF – smog formation IOD – ozone depletion IAR – acid rain IINH – human inhalation IING – ingestion toxicity ICINH -human carcinogenic inhalation ICING – carcinogenic ingestion toxicity IFT – fish toxicity
  132. Environmental Indices(Kg/L EtOH)
  133. Normalized Environmental Indices Each environmental index is multiplied by a weighting factor The sum of all weighted indices= IL-CC – life cycle composite index Life cycle composite index gives an overall value to process impacts
  134. Normalized and Weighted Environmental Indices(Kg/L EtOH) Higher Weighting Factor Newsprint process has about 6% lower life cycle composite index. Lower Weighting Factor
  135. Life Cycle Assessment -applied to cellulosic ethanol Goal and Scope Definition Interpretation Inventory Analysis Impact Assessment
  136. Life Cycle Improvement Analysis Process improvements to reduce emissions Cellulase seed reactor vent recycle stream Cellulase seed reactor vent stream as combustion air
  137. Life Cycle Improvement AnalysisSeed Reactor Recycle Stream Recycle 75% of Cellulase seed reactor vent back to the Cellulase seed reactor Recycle stream already at operating pressure Recycle stream contains 90% of required O2 concentration Yellow Poplar 4.8% reduction of compressed air 7.5 % reduction in total utilities 2.2% reduction in IL-CC Newsprint 50% reduction in compressed air 8.6% reduction in utility consumption 6.4% increase in IL-CC
  138. Life Cycle Improvement AnalysisSeed Reactor vent stream recycle Indices compared to original process Yellow Poplar All indices decreased Less volatile organic compounds released Newsprint Increase in IFT, IING, and ISF Decrease in IGW andIAR
  139. Life Cycle Improvement AnalysisSeed Reactor vent stream as combustion air Volatile Organic Compounds (VOC) from the seed reactor are combusted and used for energy Yellow Poplar 0.4% utilities reduction 20% decrease in ISF, and IING 2.7% reduction in IL-CC News Print 2.1% utilities reduction 20% decrease in ISF, and IING 18.0% reduction in IL-CC
  140. Life Cycle Improvement AnalysisSeed Reactor vent stream as combustion air Indices compared to original process The smog formation indices decrease significantly as a result of utilizing the heating value of ethanol to offset natural gas usage Reduction in the ingestion index also results from less ethanol in the vent stream
  141. Life Cycle AssessmentConclusions Newsprint Pros Less fossil fuel required in pre-manufacturing Lower ecotoxicity Lower overall IL-CC Cons Manufacturing process is not energy self sufficient Higher index for IING, IINH, ICING, ICINH, and IGW Yellow Poplar Timber Pros Manufacturing process is self sufficient and exports electricity to the grid Lower global warming index Lower impacts to human health Cons More fossil fuel required in pre-manufacturing Higher ecotoxicity Higher overall IL-CC
  142. Life Cycle AssessmentConclusions Main chemical contributors to indices acetic acid Carbon monoxide Ethanol Fossil fuel energy required to produce transportation fuel Yellow Poplar (ethanol)- 14% of energy content Newsprint (ethanol)- 27% of energy content Petroleum (gasoline/diesel)- 20% additional energy needed Future Work Impacts of large scale timber harvesting need to be examine Additional studies comparing biomass-to-ethanol facilities to petroleum refineries needed to evaluate local health impacts1
  143. LCA Overall Review What you learned how to Define the goals and scope of a LCA Perform inventory analysis Perform an impact assessment Examples reviewed Copy paper case study Building material case study Bioethanol case study
  144. Copy Paper Case Study Review The Recycling scenario has the smallest carbon footprint Landfill carbon footprint is highly dependent on the methane recovery rate Increased recycling may reduce green house gas emissions Increased recycling may impact the wood market These impacts are outside the scope of the study
  145. Housing Case Study Review Atlanta house Wood- 512 GJ embodied energy Concrete- 573 GJ embodied energy 26% higher emissions 120% higher emissions when including carbon sequestered Minneapolis Wood- 727 GJ embodied energy Steel frame- 840 GJ embodied energy 31% higher emissions 156% higher emissions when including carbon sequestered
  146. LCA Overall Review LCA has a great potential to help decrease the impacts of industrial processes LCAs can be a powerful marketing tool LCA can be an effective means to quantify and minimize emissions LCA may become increasingly important with the introduction of carbon credits
  147. References Energy Information Administration, Petrolium basic statistics; http://www.eia.doe.gov/basics/quickoil.html Kelly, Stephen; Forest Biorefineries: Reality, Hype or Something in Between?; Paper Age, March 2006; Kemppainen, Amber; Shonnard, David; Comparative Life-Cycle Assessment for Biomass-to-Ethanol Production from Different Regional Feedstocks; Department of Chemical Engineering, Michigan Technological University; Biotechnol. Prog. 2005, 21, 1075-1084. Wooley, R.; Ruth, M.; Sheehan, J.; Ibsen, K.; Majdeski, H.; Galvez. A. Lignocellulosic Biomass to Ethanol Process Design and Economics Utilizing Co-Current Dilute Acid Prehydrolysis and Enzymatic Hydrolysis Current and Future Scenarios; National Renewable Energy Laboratory, NREL/TP-580-26157, July 1999
More Related