Download
1 / 30
300 likes | 326 Views
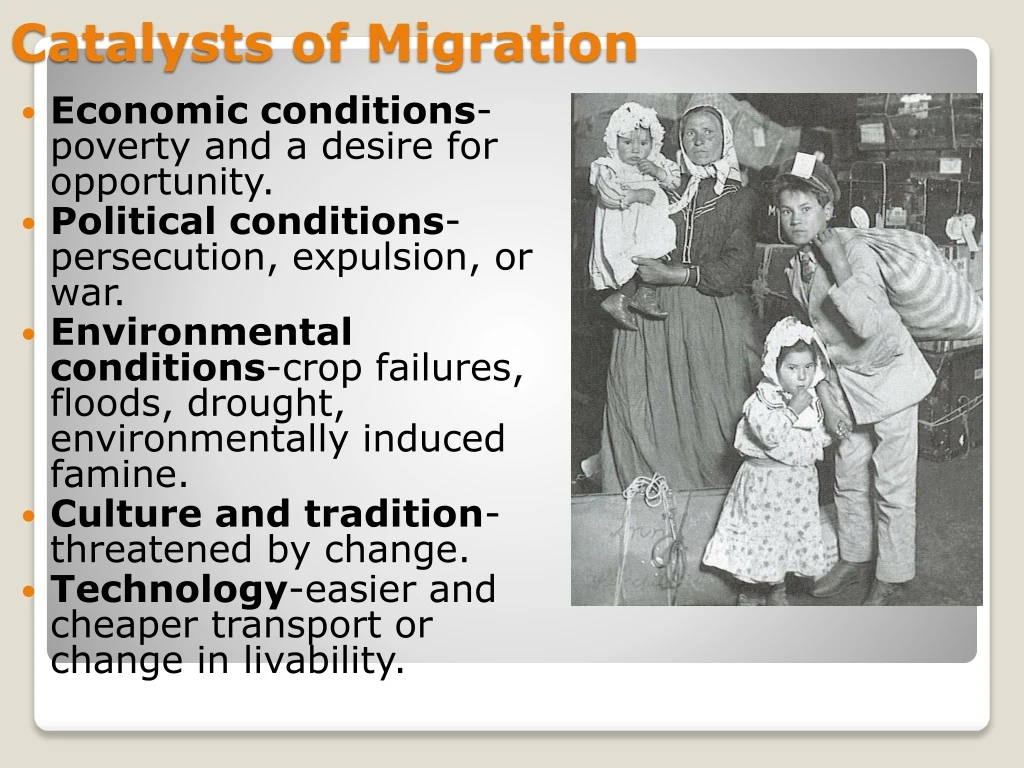
Catalysts of Migration. Economic conditions -poverty and a desire for opportunity. Political conditions -persecution, expulsion, or war. Environmental conditions -crop failures, floods, drought, environmentally induced famine. Culture and tradition -threatened by change.

E N D
Catalysts of Migration • Economic conditions-poverty and a desire for opportunity. • Political conditions-persecution, expulsion, or war. • Environmental conditions-crop failures, floods, drought, environmentally induced famine. • Culture and tradition-threatened by change. • Technology-easier and cheaper transport or change in livability.
Kinship links-allows migrants to communicate with family members • Chain migration-migration of people to a specific location because of relatives or members of the same nationality already there. • Step migration-short moves in stages-e.g. Brazilian family moves from village to town and then finally Sao Paulo or Rio de Janeiro • Intervening opportunity-alternative destinations that can be reached more quickly and easily and offer benefits to the migrant • Intervening obstacle-keeps migrant from reaching their original destination
Where have people migrated? • Europe to North America • Southern Europe to South and Central America • Britain/Ireland to Africa and Australia • Africa to Americas (Slaves) • India to East Africa, SE Asia and Caribbean
Economic Opportunities Islands of Development – Places within a region or country where foreign investment, jobs, and infrastructure are concentrated, usually centered along the coast.
Economic Opportunities In late 1800s and early 1900s, Chinese migrated throughout Southeast Asia to work in trade, commerce, and finance.
Reconnecting Cultural Groups • About 700,000 Jews migrated to then-Palestine between 1900 and 1948. • After 1948, when the land was divided into two states (Israel and Palestine), 600,000 Palestinian Arabs fled or were pushed out of newly-designated Israeli territories.
Migration that occurs within a country’s borders. Examples/Reasons for internal vs. international: same language, familiar cultural aspects, shorter distances traveled Internal Migration
Internal: within the same country • Less traumatic, more common • 2 Types • Interregional: one region to another • Intraregional: within same region • Fill in the blank: “Most common interregional migration is _______ to _______ areas in search of jobs.” Types of Migration
U.S. population has been moving Westward and Southward • Gold Rush (1849) and Donner Party just the most dramatic examples of hardship. • Wells, Pumps, Aqueducts, Mosquito Control and Air Conditioning have allowed this move which otherwise would be impossible. • Loss of Industrial Jobs in east compliments increase in Sunbelt service sector. • Increases with development; ¾ of core countries population in urban areas Rural to Urban
U.S. population has been moving out of the city centers to the suburbs: STILL URBAN REGION • Developed Countries: Suburbanization • automobiles and roads • ‘American Dream’ • better services • Lifestyle changes (babies) • Don’t need to be right in the middle of a major city anymore! Urban to Suburban U.S. intraregional migration during 1990s.
U.S. population has been moving out of the city centers to idyllic settings • Counterurbanization • idyllic settings • cost of land for retirement • slow pace, yet high tech connections to services and markets • Increased technology allows people to work outside of the city Metropolitan to Nonmetropolitan U.S. intraregional migration during 1990s.
Current USA examples • Movement North to South and East to West • Net migration (immigrants-emigrants) • South (+1,419,000) • Northeast (-915,000) • Midwest (-533,000) • West (+29,000) • Refugees/evacuees from the Gulf coast region • Rural to urban areas to find work Interregional Migrations
Populations in the less developed world are rushing to cities in search of work and income. • Urbanization • migration from rural areas • lack of jobs in countryside • lack of services in cities Interregional Migrations in LDCs Mexico City, Mexico Lagos, Nigeria Mumbai, India
Current World examples • To Brazil’s interior—Brasilia • To North in Italy • From North to South in the UK for jobs Interregional Migrations
Movement across country borders • International migration • Emigrant—one who migrates OUT of a country (exits) • Subtracts from total population • Immigrant—one who migrates INTO a country • Adds to total population External Migration
From less-developed Stage 2 countries into more developed Stage 4 or 5 countries • 3 largest migration flows • Asia to Europe • Asia to north America • Latin America to North America • Net In Migration (North America, Europe, Oceania) • Net Out Migration (Asia, Latin America, Africa) Global Migration Patterns
3 main waves • Colonial America (1607-1840) • European settlement—2 million; mostly British • African slaves—800,000 US Immigration Patterns
2. 19th century (1840-1910) • 1840s and 1850s—Northern and Western Europe (Ireland, Germany) • 1880s—Northern and Western Europe (Ireland, Germany, Norway, Sweden) • 1900-1910—Southern and Eastern Europe (Italy, Russia, Austria-Hungry) • Bosnia-Herzegovina, Croatia, Czech Republic, Poland, Romania, Slovakia, Slovenia, Ukraine US Immigration Patterns
3. Second half of 20th century (1950-2008) • Less developed regions • Latin America—Mexico, Dominican Republic, El Salvador • Asia—China, Philippines, India, Vietnam US Immigration Patterns
Prior to 1840, 90% of U.S.immigration was from Britain Two Big Waves: 1840 - 1930: W. and N. European transitioning to Southern and Eastern European by 1910 • Irish (potato famine in 1840s) and Germans • During 1900s: Italians, Russians, Austria-Hungary (Czech, Poland, Romania, etc.) • 1950 - Today: Asians and Latin Americans; declining Europeans • Asians: China, India; 1980s -1990s: Philippines, Vietnam, and South Korea • Latin America: Mexico, Dom. Rep., El Salvador, Cuba, Haiti Ellis Island National Monument U.S. Immigration
% of U.S. Immigrants • 55%--Latin America/Caribbean • 26%--Asia/pacific • 12%--Europe • 3%--Sub-Saharan Africa • 2%--North America (Canada) • 2%--Middle East US Immigration Figures (2016)
U.S. Immigration Policies • 1882, Bars Asian immigration for ten years (extended) • 1921, Quota Act - country by country quotas • 1924 National Origins Act - country by country quotas • 1965, Immigration Act - quotas for countries replaced, in 1968, with hemisphere quotas of 170, 000 for East and 120,000 for West • 1978, Immigration Act - global quota of 290, 000 • 1980, Refugee Act - quotas do not apply to those seeking political asylum • 1986, Immigration Reform and Control Act admitted large numbers of former illegals. • 1990, Immigration Act raised global quotas to roughly 675,000 • 1995, visas issued Preferentially by skills: • 480,000 - to relatives of people here • 140,000 - to those with special skills and education • 55,000 - to diversity candidates (i.e., mostly not from Latin Amer. or Asia) Current Total: 675,000 • Currently—Global quota of 620,000 w/ no more than 7% from each country • Exceptions—family reunification, employment, talented, refugees
Immigration and Naturalization Act • Limit of 675,000 immigrants (lawful permanent residents, LPRs) • Family Based immigration—immediat4e relatives (spouses, unmarried minor children of citizens, parents of citizens) • Employment Based Immigration— • Temporary visas—foreign nationals used for jobs for limited periods (intracompany transfers, athletes, entertainers, religious workers • Permanent immigration—140,000/year (extraordinary abilities, advanced degrees, religious workers, investors) • Per-country Ceilings (<7% may come from one country) • Refugee/Asylees—well founded persecution based on race, religion, political beliefs with a degree of risk involved • 2016 worldwide Refugee Ceiling—85,000 (25,000 Africans, 34,000 Asians) • Diversity Visa Program—55,000 allocated to random countries w/fewer than 50,000 persons to US in previous 5 years US Immigration Policy
Immigrant must have LPR status (green card) for the last 5 years w/ 3 months in current state; must be 18 years old with continuous residency in the U.S. and have good moral character • Immigrant must pass English, US History, and Civics exams (w/ certain exceptions) and pay an application fee among other requirements US Citizenship
Large scale emigration by talented people • People leave LDC’s and move to MDC’s for better suited opportunities to their skills • They often don’t return to their home country • 1970’s Asian immigration to U.S. (China & India) BRAIN DRAIN
Guest Workers Time Contract Workers • Newly developed areas taking advantage of cheap labor • EX—85% of Dubai (UAE) is guest workers • South and East Asian workers to SE Asia. American workers to lesser developed areas. • (US—20-140,000/year) International Migration Issues
Remittance: transfer of money by a foreign worker to an individual in his or her home country spatial interaction = “remittance corridor”
To accurately calculate a country’s population growth, we must include immigrants to see the impact they have on given states • Balancing Equation • (Births + Immigration)—(Deaths + Emigration) • This is more representative of what goes on in a country in regards to demographics. The above equation is much more accurate in depicting population issues than the Rate of Natural Increase…why? “TRUE” Population Growth
European Migrations http://www.pewresearch.org/fact-tank/2017/11/29/5-facts-about-the-muslim-population-in-europe/