
ABSTRACT
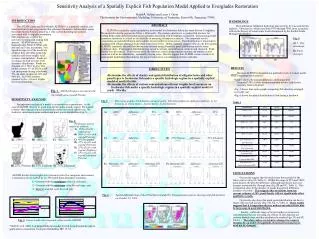
A) 100% difference 0% . B) 100% difference 25%. C) 50% difference 25%. D) 25% Poisson difference 25% Clustered. F) Maximum LTL difference Seasonal LTL.

ABSTRACT
E N D
Presentation Transcript
A) 100% difference 0% B) 100% difference 25% C) 50% difference 25% D) 25% Poisson difference 25% Clustered F) Maximum LTL difference Seasonal LTL E) Maximum LTL difference Minimum LTL Sensitivity Analysis of a Spatially Explicit Fish Population Model Applied to Everglades Restoration René A. Salinas and Louis J. Gross The Institute for Environmental Modeling, University of Tennessee, Knoxville, Tennessee 37996 INTRODUCTION The ATLSS Landscape Fish Model (ALFISH)* is a spatially-explicit, size structured functional group model that estimates freshwater fish densities across the south Florida Restudy area (Fig. 1) for a given hydrological scenario associated with Everglades restoration. HYDROLOGY The Calibration Validation hydrology data set (Fig. 4) was used for the analysis. This data set, which runs from 1979 through 1995, most accurately reflects the history of actual water levels determined by the South Florida Management District. ABSTRACT ALFISH is a spatially explicit population level model for freshwater fish in the south Florida Everglades. The model divides the region into 500m x 500m cells. The models objective is to predict fish biomass for wading birds under different hydrological scenarios associated with Everglades restoration. Determining model parameter sensitivity is critical to its reliability in assessing alternative scenarios. Two important model components are pond distribution and available lower trophic level resources. Pond distribution is important in providing fish refuges during periods when water level is low. Initial estimates suggest 34% of cells have ponds. ALFISH's sensitivity to pond distribution was assessed using alternative pond distributions and the same hydrologic data. Pond spatial distribution was varied to include spatial Poisson, uniform and clustered. Pond density was also varied. Food resources for the fish were varied using constant maxima and minima across season as well as two alternative, seasonally varying cases. Results suggest that ALFISH is more sensitive to pond spatial distribution than density, but lower trophic level concentration interacts with this. Fish densities are vital for the survival of endangered wading bird species. ALFISH divides the landscape into 500m X 500m cells and runs on 5-day increments. Two important aspects of the model are alligator hole and other pond type densities and lower trophic level resource concentration. Ponds act as refuges for fish as water level decreases (drydowns). Ponds are assumed to be 50m2 in area. Our model assumes 5% of fish in a cell can enter ponds during a drydown, 5% can enter an adjacent cell, and 90% die. ALFISH assumes seasonal cycles of lower trophic level concentrations. Fig. 4 A)5 - Day increments B)Yearly Averages A) B) • RESULTS • Because ALFISH is designed as a qualitative tool, it is most useful when comparing two scenarios. • Table 1 shows the percent difference, (difference/2nd Scenario)*100, at three distinct years that involve fish density recovery from a drydown. • Fig. 5 shows time series graphs comparing fish densities averaged over each year. • Fig. 6 shows the spatial distribution of fish during a drydown. • OBJECTIVES • Determine the effects of density and spatial distribution of alligator holes and other pond types to freshwater fish under a specific hydrologic regime in a spatially-explicit model of south Florida. • Determine the effects of various concentrations of lower trophic level resources on freshwater fish under a specific hydrologic regime in a spatially-explicit model of south Florida. Fig. 1. ATLSS subregions associated with the restudy area of south Florida SENSITIVITY ANALYSIS An important analysis of a model is its sensitivity to parameters. In the case of ALFISH, there is no pond map for the entire restudy region. We wanted to know what aspects of pond densities the model was most sensitive to. We looked at variations in pond number and pond spatial distribution (Fig 2). Fig. 5. Time series graphs of fish density averaged yearly. The three graphs are defined as follows: 1) 1st Scenario, 2) (1st Scenario - 2nd Scenario), 3) 2nd Scenario. Table 1 Fig. 2: Pond maps used in sensitivity analysis. A) 100% of cells with a pond B) 50% of cells with a pond(Poisson) C) 0% (No ponds) D) 25% of cells with a pond (Poisson) E) 25% of cells with a pond (Uniform) F) 25% of cells with a pond (clustered Poisson) A) 100%B) 50%C) 0% D) 25% PoissonE) 25% Uniform F) 25%Clustered CONCLUSIONS Our results suggest that the model must have ponds for the fish to survive (Fig 5A, Table 1). Within the range of 25% and 100% pond density, the percent difference, although significant, does not increase exponentially through time (Fig 5B and 5C, Table 1). This is important since in the absence of ponds the percent difference increases over time. This suggests that deviations from our current estimate of 34% pond density will not significantly affect qualitative results. Our results also show that pond spatial distribution can have a major effect on fish density (Fig. 5D, Fig. 6, Table 1). These results suggests that it is important that we understand where there may be large gaps in pond distribution. Finally, within the range of lower trophic level resource concentrations that we are using, the effects on fish densities are uniform through time and thus qualitatively similar (Figs. 5E and 5F, Table 1). Therefore, unless we intend to change the resource densities by an order of magnitude, the present seasonal cycle need not be changed. ALFISH divides lower trophic level resources into five categories and assumes a seasonal cycle for each (Fig. 3). We tested three alternative scenarios: 1) Constant with the maximum value for each type, 2) Constant with the minimum value for each type, and 3) Inverse seasonal cycle for each type. Fig. 6Spatial difference map of the 25% Clustered and 25% Poisson pond scenarios showing total fish densities on October 13, 1993. Fig. 3. Lower trophic level seasonal cycles used by ALFISH. *Gaff, H. et al. 2000. A dynamic landscape model for fish in the Everglades and its application to restoration. Ecological Modelling 127: 33-52.


