Download
1 / 73
730 likes | 748 Views
Explore the main sources of genetic variation in populations and how evolution is defined in genetic terms. Learn about the impact of natural selection and genetic drift on single-gene and polygenic traits. Discover the conditions needed to maintain genetic equilibrium.

E N D
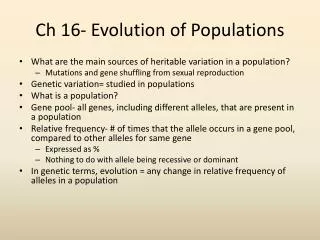
KEY CONCEPT QUESTIONS • What are the main sources of inheritable variation in a population? • How is evolution defined in genetic terms? • What determines the number of phenotypes for a given trait?
1859 Darwin published his theory of evolution • 1866 Mendel worked with peas to explain inheritance • These two ideas did not come together until the 1930’s • Today, genetics, molecular biology, and evolutionary theory work together to explain how inheritable variation appears and how natural selection operates on that variation
What is a species? • Biological species concept • defined by Ernst Mayr • population whose members can interbreed & produce viable, fertile offspring • reproductively compatible
POPULATION • a collection of individuals of the same species in a defined area • GENEPOOL • the combined genetic information of all the members of a particular population • common group of genes • contains two or more alleles—or forms of a certain gene—for each inheritable trait
Changes in populations • Evolution of populations is really measuring changes in allele frequency • all the genes & alleles in a population = gene pool • Factors that alter allele frequencies in a population • natural selection • genetic drift • founder effect • bottleneck effect • gene flow
Populations evolve • Natural selection acts on individuals • differential survival • “survival of the fittest” • differential reproductive success • who bears more offspring • Populations evolve • genetic makeup of population changes over time • favorable traits (greater fitness) become more common Bent Grass on toxic mine site
RELATIVEFREQUENCY • the number of times that allele occurs in a gene pool compared with the number of times other alleles occur • expressed in percents
Relative Frequencies of Alleles Sample Population Frequency of Alleles allele for brown fur allele for black fur 48% heterozygous black 16% homozygous black 36% homozygous brown
What are the main sources of genetic variation in a population? • The two main sources of genetic variation are mutations and the genetic shuffling that results from sexual reproduction.
Mutation & Variation • Mutation creates variation • new mutations are constantly appearing • Mutation changes DNA sequence • changes amino acid sequence? • changes protein? • change structure? • change function? • changes in protein may change phenotype & therefore change fitness
Sex & Variation • Sex spreads variation • one ancestor can have many descendants • sex causes recombination • offspring have new combinations of traits = new phenotypes • Sexual reproduction recombines alleles into new arrangements in every offspring
Gene Shuffling • independent assortment during meiosis • crossing-over during meiosis • When alleles are recombined during sexual reproduction, they can produce dramatically different phenotypes. Thus, sexual reproduction is a major source of variation within many populations.
Variation impacts natural selection • Natural selection requires a source of variation within the population • there have to be differences • some individuals must be more fit than others
SINGLE-GENETRAIT • trait controlled by a single gene that has two alleles • can have two phenotypes only • widow’s peak hairline
Distribution of Phenotypes for Single-Gene Trait in a Population 100 80 60 40 20 0 Frequency of Phenotype (%) Widow’s peak No widow’s peak Phenotype
POLYGENICTRAITS • Traits controlled by two or more genes • each gene has two or more alleles • one polygenic trait can have many possible genotypes and even more possible phenotypes • height in humans
Generic Bell Curve for Polygenic Trait in a populationMost people fall in the middle of the bell curve Frequency of Phenotype Phenotype (height)
KEY CONCEPT QUESTIONS • What are the main sources of inheritable variation in a population? • Mutations and sexual reproduction • How is evolution defined in genetic terms? • genetic makeup of population changes over time • favorable traits (greater fitness) become more common • What determines the number of phenotypes for a given trait? • The number of genes that control the trait
KEY CONCEPT QUESTIONS • How does natural selection affect single-gene and polygenic traits? • What is genetic drift? • What 5 conditions are needed to maintain genetic equilibrium?
Naturalselection affects which individuals having different phenotypes survive and reproduce and which do not • In this way, natural selection determines which alleles are passed from one generation to the next. • Any factor that causes alleles to be added to or removed from a population will change the relative frequencies of alleles.
Whenever an individual dies without reproducing, its genes are removed from the population. • But if an individual produces many offspring, the proportion of that individual’s genes in the gene pool will increase. • In genetic terms, evolution is any change in the relative frequencies of alleles in a population’s gene pool. • Thus, evolution acts on populations, not on individuals.
Take a look: • Brown is the normal color
Besides a mutation for red color, what other mutation occurred in the lizard population? • A mutation for black color • How does color affect the fitness of the lizards? • Both red and brown lizards are less fit than black lizards
What do you predict the lizard population will look like by generation 50? Explain. • The lizard population will have more black lizards, fewer brown lizards, and no red lizards by generation 50. The environment determines the favorable color.
As you learned earlier: • the action of multiple alleles on traits such as height produces a range of phenotypes that often fit a bell curve • The fitness of individuals close to one another on the curve will not be very different. • But fitness can vary a great deal from one end of such a curve to the other. • And where fitness varies, natural selection can act.
Witness to Evolution • Peppered Moth • dark vs. light variants Peppered moth
Peppered moth Year% dark% light 1848595 1895982 19951981
Peppered moth • Why did the population change? • early 1800s = pre-industrial England • low pollution • lichen growing on trees = light colored bark • late 1800s = industrial England • factories = soot coated trees • killed lichen = dark colored bark • mid 1900s = pollution controls • clean air laws • return of lichen = light colored bark • industrial melanism
Natural selection can affect the distributions of phenotypes in any of three ways: directional selection, stabilizing selection, or disruptive selection.
DIRECTIONAL SELECTION • When individuals at one end of the curve have higher fitness than individuals in the middle or at the other end
Ex) The supply of small seeds runs low in a particular environment. Take a look at the graph below and explain what is happening. • - the birds with larger beaks are more likely to survive and reproduce because their beaks are adapted to the available food. There is a shift in the beak size of a population.
STABILIZING SELECTION • When individuals near the center of the curve have higher fitness than individuals at either end of the curve • EX) Figure shows that human babies born at an average mass are more likely to survive than babies born either much smaller or much larger than average
DISRUPTIVE SELECTION • when individuals at the upper and lower ends of the curve have higher fitness than individuals near the middle • EX) average-sized seeds become less common, and larger and smaller seeds become more common. As a result, the bird population splits into two subgroups specializing in eating different-sized seeds.
Effects of Selection • Driving changes in a population
GENETIC DRIFT • random change in allele frequencies that occurs in small populations • In small populations, individuals that carry a particular allele may leave more descendants than other individuals do, just by chance. Over time, a series of chance occurrences of this type can cause an allele to become common in a populationa
Genetic drift • Effect of chanceevents • founder effect • small group splinters off & starts a new colony • bottleneck • some factor (disaster) reduces population to small number & then population recovers & expands again
Bottleneck effect • When large population is drastically reduced by a disaster • famine, natural disaster, loss of habitat… • loss of variation by chance • alleles lost from gene pool • narrows the gene pool
Cheetahs • All cheetahs share a small number of alleles • less than 1% diversity • as if all cheetahs are identical twins • 2 bottlenecks • 10,000 years ago • Ice Age • last 100 years • poaching & loss of habitat
Conservation issues • Bottlenecking is an important concept in conservation biology of endangered species • loss of alleles from gene pool • reduces variation • reduces ability to adapt • at risk populations
Genetic Drift Sample of Original Population Descendants Founding Population A Founding Population B
Genetic Drift Sample of Original Population Descendants Founding Population A Founding Population B
Genetic Drift Sample of Original Population Descendants Founding Population A Founding Population B
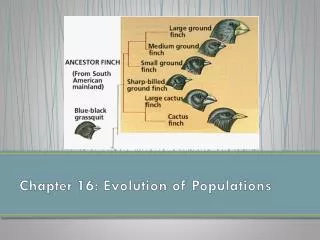
FOUNDER EFFECT • situation in which allele frequencies change as a result of the migration of a small subgroup of a population • Darwin’s Finches • Fruit flies on Hawaii
Founder effect • When a new population is started by only a few individuals • some rare alleles may be at high frequency; others may be missing • skew the gene pool of new population • human populations that started from small group of colonists • example: white people colonizing New World