Download
1 / 49
490 likes | 527 Views
Explore the evolution of populations, gene traits, and natural selection. Learn about gene shuffling, polygenic traits, and how natural selection impacts phenotypes. Discover directional, stabilizing, and disruptive selection.

E N D
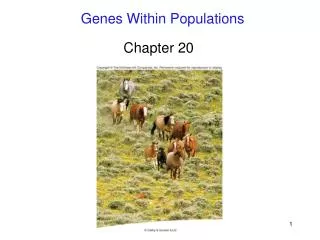
When Darwin developed his theory of evolution, he did not understand: • how heredity worked. This left him unable to explain two things: a.source of variation b. how inheritable traits pass from one generation to the next
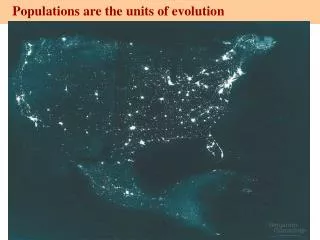
In the 1940’s, Mendel’s work on genetics was “rediscovered” and scientists began to combine the ideas of many branches of biology to develop a modern theory of evolution. When studying evolution today, biologists often focus on a particular population. This evolution of populations is called microevolution.
2. Vocabulary: population: group of individuals of the same species living in the same area that breed with each other.
2. gene pool: combined genetic info. for all members of a population
2. relative frequency of an allele: # times an allele occurs in the gene pool compared to other alleles (percent) Example Relative Frequency: 70% Allele B 30% Allele b
3. Sources of Variation: a. mutations: any change in DNA sequence • Can occur because of: • mistakes in replication • environmental chemicals • May or may not affect an organism’s phenotype
3. Sources of Variation b. Gene Shuffling: recombination of genes that occurs during production of gametes • Cause most inheritable differences between relatives • Occurs during meiosis • As a result, sexual reproduction is a major source of variation in organisms. • Despite gene shuffling, the frequency of alleles does not change in a population. Explain why this is true. Similar to a deck of cards – no matter how many times you shuffle, same cards (alleles) are always there.
4. Gene Traits: A) Single gene trait:controlled by single gene with two alleles • Examples: widow’s peak, hitchhiker’s thumb, tongue rolling
(4. Gene Traits:) B) Polygenic trait: controlled by 2 or more genes, each with 2 or more alleles Examples: height, hair color, skin color, eye color Most human traits are polygenic.
Do the following graphs show the distribution of phenotypes for single-gene or polygenic traits? Explain. type: single gene why? Only two phenotypes possible Example: tongue roller or non-tongue roller type: polygenic why? Multiple (many) phenotypes possible Example: height range 4feet to 9 feet all
5. Natural selection acts on phenotypes, not genotypes. Example: in a forest covered in brown leaves, dirt and rocks which mouse will survive better brown or white? Brown, more hidden.
BB Bb 5. If brown is dominant can the a predator tell the difference between: Mouse with highest fitness will have the most alleles passed on to the next generation. White mouse will have low fitness ?
BB Bb 5. Which mouse will have the lowest fitness? White, bb (recessive) Will the fitness of BB and Bb differ? Why? No, Both BB and Bb have the same fitness advantage of being brown ?
6. Three ways in which natural selection affects polygenic traits.
Key Low mortality, high fitness High mortality, low fitness Food becomes scarce. a. Directional Selection: individuals at one end of the curve have higher fitness so evolution causes increase in individuals with that trait • Individuals with highest fitness: those at one end of the curve • Example: Galapagos finches – beak size
Key Low mortality, high fitness High mortality, low fitness Food becomes scarce. Directional Selection (page 398) Directional Selection
Stabilizing Selection Key Low mortality, high fitness High mortality, low fitness Selection against both extremes keep curve narrow and in same place. Percentage of Population Birth Weight b. Stabilizing Selection: individuals at the center of the curve have highest fitness; evolution keeps center in the same position but narrows the curve • Individuals with highest fitness: near the center of the curve (average phenotype) • Example: human birth weight
Stabilizing Selection Key Low mortality, high fitness High mortality, low fitness Selection against both extremes keep curve narrow and in same place. Percentage of Population Birth Weight Stabilizing Selection
Disruptive Selection Largest and smallest seeds become more common. Key Population splits into two subgroups specializing in different seeds. Low mortality, high fitness Number of Birdsin Population Number of Birdsin Population High mortality, low fitness Beak Size Beak Size c. Disruptive Selection: individuals at both ends of the curve survive better than the middle of the curve. • Individuals with highest fitness: both ends of curve • Example: birds where seeds are either large or small
Disruptive Selection Largest and smallest seeds become more common. Key Population splits into two subgroups specializing in different seeds. Low mortality, high fitness Number of Birdsin Population Number of Birdsin Population High mortality, low fitness Beak Size Beak Size Disruptive Selection (pg 399)
Quiz Monday!! • Evolution review ½ sheet. (yes some questions are missing) • Thursday and Friday’s concepts will be on the quiz: • Directional, Stabilizing and Disruptive selection. • Geographic, Behavioral, Temporal Isolation • Small populations caused by bottleneck and founder effect
The Process of Speciation • The formation of new biological species, usually by the division of a single species into two or more genetically distinct one.
Three Isolating Mechanisms: Isolate species forming subspecies and perhaps causing speciation. • Geographic Isolation • Behavioral Isolation • Temporal Isolation
1. Geographic Isolation • Two populations separated by a geographic barrier; river, lake, canyon, mountain range.
Example: 10,000 years ago the Colorado River separated two squirrel populations. • Kaibab Squirrel Abert Squirrel
This resulted in a subspecies, but did not result in speciation because the two can still mate if brought together • Kaibab Squirrel Abert Squirrel
2. Behavioral Isolation • Two populations are capable of interbreeding but do not interbreed because they have different ‘courtship rituals’ or other lifestyle habits that differ.
Example: Eastern and Western Meadowlark • Eastern and Western Meadowlark populations overlap in the middle of the US
Example: Eastern and Western Meadowlark • Male birds sing a matting song that females like, East and West have different songs. Females only respond to their subspecies song.
3. Temporal Isolation Populations reproduce at different times January 1 2 3 4 5 6 7 8 9 10 11 12 13
Example: Northern Leopard Frog & North American Bullfrog • Mates in: Mates in: April July
Conclusion: • Geographic, Behavioral and Temporal Isolation are all believed to lead to speciation.
However: • No examples ever observed in animals • A couple examples that may demonstrate speciation exist in plants and some insects.
Genetic Drift • random change in allele frequency that occurs in small populations
The results of genetic crosses can usually be predicted using the laws of probability. In small populations, however, these predictions are not always accurate. a. Founder effect: allele frequencies change due to migration of a small subgroup of a population • Example: fruit flies on Hawaiian islands
Two phenomena that result in small populations and cause genetic drift • Founder Effect • Bottleneck Effect
Founder effect allele frequencies change due to migration of a small subgroup of a population
Sample of Original Population Descendants Founding Population A Founding Population B Founder Effect: : Fruit Flies on Hawaiian islands
2. Bottleneck effect major change in allele frequencies when population decreases dramatically due to catastrophe • Example: northern elephant seals decreased to 20 individuals in 1800’s, now 30,000 no genetic variation in 24 genes
Bottleneck Effect: Northern Elephant Seal Population • Hunted to near extintion • Population decreased to 20 individuals in 1800’s, those 20 repopulated so today’s population is ~30,000 • No genetic variation in 24 genes
Bottleneck Effect Original population
Bottleneck Effect Catastrophe Original population
Bottleneck Effect Catastrophe Surviving population Original population