Download
1 / 20
200 likes | 404 Views
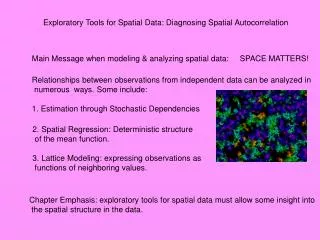
Exploratory Tools for Spatial Data: Diagnosing Spatial Autocorrelation. Main Message when modeling & analyzing spatial data: SPACE MATTERS!. Relationships between observations from independent data can be analyzed in numerous ways. Some include:

E N D
Exploratory Tools for Spatial Data: Diagnosing Spatial Autocorrelation Main Message when modeling & analyzing spatial data: SPACE MATTERS! Relationships between observations from independent data can be analyzed in numerous ways. Some include: 1. Estimation through Stochastic Dependencies 2. Spatial Regression: Deterministic structure of the mean function. 3. Lattice Modeling: expressing observations as functions of neighboring values. Chapter Emphasis: exploratory tools for spatial data must allow some insight into the spatial structure in the data.
For instance, stem & leaf plots and histograms pictorially represent the data, but tell us nothing about the data’s spatial orientation or structure. (Histogram) (Stem & Leaf Plot)
Example of using lattice modeling to demonstrate importance of retaining spatial information: 10 X 10 lattices filled with 100 observations drawn at random. Lattice B is an assignment to positions such that a value is surrounded by values similar in magnitude. Lattice A is a completely random assignment of observations to lattice positions.
Histograms of the 100 observed values that do not take into account spatial position will be identical for the two lattices: Note: The density estimate is not an estimate of the probability distribution of the data; that requires a different formula. Even if the histogram is calculated by lumping data across spatial locations appears Gaussian does not imply that the data are a realization of a Gaussian random field.
Plotting observed values against the average value of the nearest neighbors the difference in the spatial distribution between the two lattices emerge: Terminology: The data in lattice A are not spatially correlated and the data in lattice B are very strongly autocorrelated.
Outliers Distinguishing between spatial and non-spatial arrangements can detect outliers. In a box plot or a stem & leaf plot, outliers are termed “distributional.” A “spatial” outlier in an observation that is unusual compared to its surrounding values. Diagnosing Spatial Outliers: Median-Polish the data, meaning remove the large scale trends in the data by some outer outlier-resistant method, and to look for outlying observations in a box-plot of the median-polished residuals. Use of Lag Plots (Previous example)
Concerning Mercer and Hall Grain Yield. 1 S+Spatial States Code: Bwplot(y~grain, data=wheat, ylab=“Row”, xlab= “Grain Yield”) Bwplot (x~grain,data=wheat, ylab=“Column”, xlab= “Grain Yield”)
Describing, Diagnosing, and Testing the Degree of Spatial Autocorrelation Geostatistical Data: the empirical semivariogram provides an estimate of the spatial structure. Lattice data JOINT-COUNT statistics have been developed for binary and nominal data. Moran (1950) and Geary (1954): developed autocorrelation coefficients for continuous attributes observed on lattices. Coefficient Moran’s “I” and Geary’s “C.” Comparing an estimate of the covariation among the Z(s) to an estimate of their variation. 2
Moran's I Let Z(si), i= 1,2,3,…,n denote the attribute Z observed at site si and Ui= Z(si)- Z its centered version. wij denotes the neighborhood connectivity weight between sites si and sj with wii= 0.
In the absence of spatial autocorrelation, I has an expected value E[I]= -1/(n-1) values I > E[I] indicate positive autocorrelation. values I < E[I] indicate negative autocorrelation. To determine whether a deviation of I from its expectation is statistically significant one relies on the asymptotic distribution of I which is Gaussian with mean -1/(n-1) and variance δ2I. The hypothesis of no spatial autocorrelation is rejected at the α x 100% significance level if |Zobs| = |I- E[I]| / σI is more extreme than the za/2 cutoff of a standard Gaussian distribution.
2 approaches to derive variance • Assume Z(si) are Gaussian • Under Null Hypothesis, Z(si) are • assumed G(μ,σ2), so that • Ui ~ (0, σ2(1-1/n)) 2. Randomization Framework Z(si) are considered fixed; randomly permuted among the n lattice sites. There are n! equally likely random permutations and σI2 is the variance of the n! Moran I values. 3 Best Alternative to Randomization. $$$$$$
Utilizing SAS Calculates the Zobs statistics and p-values under the Gaussian and randomization assumption. Data containing the W matrix (W= [wij] ) is passed to the macro through the w_data option. (we are utilizing SAS®macro %MoranI) For rectangular lattices: use the macro %ContWght (in file \SASMacros\ContiguityWeights.sas) calculates the W matrices for classical neighborhood definitions.
%include ‘DriveLetterofCDROM: \Data\SAS\MercerWheatYieldData.sas’; %include ‘DriveLetterofCDROM: \SASMacros\ContiguityWeights.sas’; %include ‘DriveLetterofCDROM: \SASMacros\MoranI.sas’; Title1 “Moran’s I for Mercer and Hall Wheat Yield, Rook’s Move”; %Contwght (rows=30, cols=25, move=rook, out=rook); %MoranI(data=mercer, y=grain, row=row, col=col, w_data=rock); 4
Limitations of Moran's I • Sensitive to large scale trends in data • Very sensitive to the choice of the neighborhood matrix W If the rook definition (edges abut) is replaced by the bishop’s move (touching corners), the autocorrelation remains significant but the value of the test statistic is reduced by about 50%. Title1 Moran’s I for Mercer and Hall Wheat Grain Data, Bishop’s Move”; %ContWght (row=20, cols=25, move=bishop, out=bishop); %MoranI(data=mercer, y=grain, row=row, col=col, w_data=bishop); 5
Linear Model: Z=1.4 + 0.1x + 0.2y +0.002x2 + e, e~iidG(0,1), where x and y are the lattice coordinates. Data simulate; do x= 1 to 10; do y= 1 to 10; z= 1.4 + 0.1*x + 0.2*y +0.002*x*x + rannor(2334); output; end; end; Run; Title1 “Moran’s I for independent data with large-scale trend”; %ContWght(rows=10, cols=10, move=rock, out=rock); %MoranI(data=simulate, y=z, row=x, col=y, w_data=rook) Test indicates strong positive “autocorrelation” which is an artifact of the changes in E[Z] rather than stochastic spatial dependency among the sites.
IF trend contamination distorts inferences about the spatial autocorrelation coefficient, then it seems reasonable to remove the trend and calculate the autocorrelation coefficient from the RESIDUALS. The residual vector Modified I test statistic The mean and variance differ a little bit, now, the E[I*] depends on the weights W and the X matrix. (6)
Title1 “Moran’s I for Mercer and Hall Wheat Yield Data”; Title 2 “Calculated for Regression Residuals”; %include “DriveLetterofCDROM: \SASMacros\MoranResiduals.sas’; Data xmat: set mercer; x1= col; x2= col**2, x3= col**3; keep x1 x2 x3 Run; %RegressI(xmat=xmat, data=mercer, z=grain, weight=rook, local=1); This particular code fits a large scale mean model with cubic column effects and no row effects. This adds higher order terms for column effects and leaves the results essentially unchanged. 7
The value of Zobs is slightly reduced from Output 9.3(slide 14) indicating that the column trends did add some false autocorrelation. P value is highly significant, conventional tests for independent data is not a fun analysis.
8 Optional Parameter: local= The business of LISA LISA: Local Indicator of Spatial Association The interpretation is that if the test statistics is < Expected Value then sites connected to each site si have attribute values dissimilar from Z(si) A high (low) value at si is surrounded by low (high) values. If the test statistic is > Expected Value, then a high (low) value at Z(si) is surrounded by high (low) values at connected sites.
Graph shows detrended Mercer and Hall grain yield data with sites with positive LISAs. Hot-spots where autocorrelation is locally much greater than for the remainder of the lattice is obvious.