Download
1 / 99
1.02k likes | 1.17k Views
This status update provides an overview of the SBIR Phase I project focused on the TopoAssistant tool, designed to enhance the refinement of feature data for military applications using innovative spatial data mining techniques. The project aims to automate the identification of positional errors and improve feature attribution, making the data refinement process more efficient. Key topics include Phase I results, prototype demonstrations, technical challenges, and the approach for future phases. Team members include experts from ATC and the University of Minnesota.

E N D
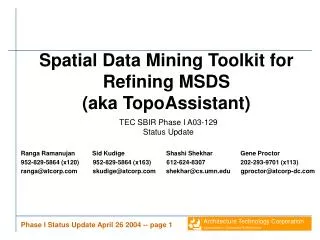
Spatial Data Mining Toolkit for Refining MSDS(aka TopoAssistant) TEC SBIR Phase I A03-129 Status Update Ranga Ramanujan Sid Kudige Shashi Shekhar Gene Proctor 952-829-5864 (x120) 952-829-5864 (x163) 612-624-8307 202-293-9701 (x113) ranga@atcorp.com skudige@atcorp.com shekhar@cs.umn.edu gproctor@atcorp-dc.com
Agenda SBIR Review 09:00 - 12:00 Kudige Lunch 12:00 - 01:00 ATC R&D Overview 01:00 - 01:45 Ramanujan Spatial Data Mining 01:45 - 02:15 Shekhar Research at UMN Facility Tour 02:15 - 02:45 Proctor
Outline • SBIR goal, motivation and innovations • Phase I results • Phase I prototype demonstration • Technical challenges • Phase II technical approach • Phase II work plan • Summary
Overall SBIR Goal • Develop TopoAssistant tool for assisting Army topographers with refinement of feature data for “just-in-time” MSDS • Phase I Goal • Develop architecture and design of TopoAssistant software tool • Build rapid prototype to establish implementation feasibility • Phase II Goal • Build full-scale operational prototype of TopoAssistant • Phase III Goal • Transition TopoAssistant to fielded system • Team • Sid Kudige - PI • Ranga Ramanujan - Tech. Advisor • Prof. Shashi Shekhar - Consultant • Gene Proctor - Commercialization
Motivation and Payoff • Current process for refining MSDS feature data is time consuming and expensive • Study estimate of 2,400 production hours for DTOP 5 data set for 15’X15’ cell size [Kabinier] • TopoAssistant tool will use innovative spatial data mining techniques to • Significantly automate feature data refinement • Detection of errors in source data • Prediction of positional errors • Prediction of extra/erroneous/missing features • Predicting mislabeled features • Feature attribution • Prediction of missing features (categorical) • Prediction of erroneous/missing attribute values (numerical) • Support timely and cost-effective Army co-production and value adding for MSDS feature data
TopoAssistant Innovations • Novel approach for automating the feature data refinement using spatial data mining techniques • Detection of errors • Spatial outlier detection • statistical/empirical rules • collocation based rules • Feature attribution • Attribute/Location prediction techniques • collocation based rules • Open/Extensible implementation architecture • Plug-in/add-on spatial data mining techniques • C/JMTK framework compliant • Seamless integration with commercial GIS products
Outline • SBIR goal, motivation and innovations • Phase I results • Phase I prototype demonstration • Technical challenges • Phase II technical approach • Phase II work plan • Summary
Phase I Results • Demonstrated TopoAssistant feasibility • Implementation feasibility: Built prototype • Concept feasibility: Designed prototype evaluation methodology for TEC datasets • Concept feasibility: Applied spatial data mining techniques for • Detection of errors • Prediction of positional errors • Prediction of extra/erroneous/missing features • Prediction of mislabeled features • Feature attribution • Prediction of missing features • Identified technical challenges and Phase II approach for addressing them
Implementation Feasibility: Phase I Prototype Architecture FRONT- END SPATIAL DATA MINING COMPONENT OUTLIER DETECTION/ COLLOCATION PACKAGE (Weka) CONVERT SQLTABLES INTO SHAPEFILES BACK-END SPATIAL DATABASE COMPONENT JDBC BRIDGE SPATIAL JOINS USING SQL QUERIES LOAD SQL TABLES INTO POSTGRES/ POSTGIS SHAPEFILE TO SQL CONVERSION (SHP2PGSQL) SHAPEFILE DATASET SHAPEFILES DATA VISUALIZATION COMPONENT VISUALIZE SHAPEFILES WITH ARCEXPLORER INTO MAPS
Architecture Components • Back-end Spatial Database Component • PostGIS - Spatially enables Postgresql table ogis compliant • Shp2pgsql tool - Shapefile to SQL table conversion using • Bulk loader - Load SQL tables into spatially enabled database • Front-end Data Mining Component • Weka - Java based public domain software that implements classical data mining techniques • Custom spatial data mining classes - spatial outlier detection/collocation pattern detection package implemented for Weka • Pgsql2shp - Convert SQL tables returned as a result of outlier detection /collocation pattern detection operation into shapefiles using
Architecture Components • Connector Component - JDBC Bridge • Java client in Weka can access PostGIS “geometry” objects in Postgres database using JDBC extensions bundled with Postgres and PostGIS. • JDBC bridge successfully tested on test machine • Map Visualization Component • ArcExplorer for shapefile visualization
Prototype Evaluation Methodology • Received Korea dataset from TEC • Reviewed dataset using ArcExplorer • Leveraged spatial database component to convert shapefile to SQL script • Loaded table in Postgres/PostGIS • Formulated and ran SQL3/OGIS queries to mine outliers/collocation patterns and compute interest mean • Converted resulting tables into shapefiles • Visualized results using ArcExplorer
TEC Dataset Overview • Korea dataset • Latitude37deg15min to 37deg30min • Longitude 128deg23min51sec to 128deg23min52sec • Layers • Obstacles (Cut, embankment, depression) • Surface drainage (River, stream, island, common open water, ford, dam) • Slope • Soils (Poorly graded gravel, clayey sand, organic silt,disturbed soil) • Vegetation (Land subject to inundation, cropland, rice field, evergreen trees, mixed trees) • Transport (Roads, cart roads, railways)
TEC Dataset Overview • Visualized using ArcExplorer except elevation data • Interpreted feature sets in TEC datasets • Using FACC • Except common open water feature (surface drain layer) • Pattern rich • Numerous spatial outliers • Collocation patterns • Promising test dataset for spatial data mining
Phase I Results • Demonstrated TopoAssistant feasibility • Implementation feasibility: Built prototype • Concept feasibility: Designed prototype evaluation methodology for TEC datasets • Concept feasibility: Applied spatial data mining techniques for • Detection of errors • Prediction of positional errors • Prediction of extra/erroneous/missing features • Prediction of mislabeled features • Feature attribution • Prediction of missing features • Identified technical challenges and Phase II approach for addressing them
Detecting Errors via Spatial Outliers • Motivation - Improve map accuracy by detecting/predicting • Positional errors • Extra/erroneous/missing features • Mislabeled/misclassified features • Spatial outlier detection techniques • Statistical/user defined tests • Collocation patterns
Spatial Outliers Detected • Statistical/user defined tests • Disconnected road • Overlapping road and river
Statistical/Empirically Derived Outliers Positional Error: Disconnected Roads • 6 Disconnected roads discovered • Visual inspection may not reveal disconnect without further zooming • May be indicative of positional error • Distance threshold is 0.001 units Road 2 Road 4 Road 5 Road 3 Legend Road 1 Disconnected Road Road 6
Statistical/Empirically Derived Outliers Positional Error: Disconnected Roads • 6 Disconnected roads discovered • Visual inspection may not reveal disconnect without further zooming • May be indicative of positional error • Distance threshold is 0.001 units Road 2 Disconnect Road 4 Road 5 Disconnect Road 3 Disconnect Disconnect Disconnect Legend Road 1 Disconnected Road Disconnect Road 6
Disconnected Road: Magnified View Road 1 Disconnected
Disconnected Road: Magnified View Disconnected Road 2
Disconnected Road: Magnified View Disconnected Road 3 Disconnected
Disconnected Road: Magnified View Disconnected Road 3
Disconnected Road: Magnified ViewFrontage Road Example End point of road geometry Road 4 Disconnected ? Interesting because end-point of Road 4 doesn’t appear visually to be close to end-point of other road. Or is it ? Afterthought: Road 4 resembles frontage road
Disconnected Road: Magnified View Road 5 Disconnected
Disconnected Road: Magnified View Disconnected Road 6
Disconnected Road:Additional Outlier Discovered Disconnected Outlier ! Road 6
Detecting Disconnected Roads:Empirical Technique Used • Determine and store start-point and end-point of each road in the road table • Calculate distance between start-point and end-point of each road with start-point and end-point of every other road • Flag roads whose ends are at distance less than 0.001 units from each other as outliers
Detecting Disconnected Roads: Spatial Query Fragment CREATE VIEW Road AS SELECT T.id as Road_id, T.the_geom as Road_Geometry, startpoint ( T.the_geom ) as Road_Start_Point, endpoint ( T.the_geom ) as Road_End_Point FROM Road_Line_Table T; CREATE VIEW Disconnected_Road AS SELECT R1.Road_id as Disconnected_Road_id FROM Road R1, Road R2 WHERE ( disjoint ( R1.Road_Geometry, R2.Road_Geometry ) = true ) AND ( distance ( R1.Road_Start_Point, R2.Road_Start_Point ) < 0.001 OR distance ( R1.Road_Start_Point, R2.Road_End_Point ) < 0.001 OR distance ( R1.Road_End_Point, R2.Road_Start_Point ) < 0.001 OR distance ( R1.Road_End_Point, R2.Road_End_Point ) < 0.001 ) ; CREATE TABLE Disconnected_Road_Outlier AS SELECT DISTINCT R.* FROM Road_Line_table R, Disconnected_Road D WHERE R.id = D. Disconnected_Road_id ;
Detecting Disconnected RoadsSpatial Query Performance • Machine used - 1.4 GHz Athlon with 512 MB RAM • Total execution time - 4.5 minutes
Statistical/Empirically Derived OutliersRoad Frequently Crossing River • Road frequently crossing river • Visual inspection may not reveal outlier without further zooming • May be indicative of positional error • Threshold = 0.001 units Road 3 Legend River Road Road 1 Road 2
Statistical/Empirically Derived OutliersRoad Frequently Crossing River • Road frequently crossing river • May be indicative of positional error Road 3 Outlier Legend River Outlier Road Road 1 Outlier Road 2
Road Frequently Crossing River: Magnified View Outlier Outlier Road 1 Legend River Road Bridge
Road Frequently Crossing River: Magnified View Road 2 Legend River Outlier Road Bridge
Road Frequently Crossing River: Magnified View Legend River Road 3 Road Bridge Outlier
Detecting Road Frequently Crossing River:Empirical Technique Used • Determine intersections of roads and rivers • Identify location pairs • If the distance between any two location pairs is less than 0.001 units, it is classified as an outlier • Ensure that there is no bridge geometry feature between the two location pairs
Detecting Road Frequently Crossing RiverSpatial Query Fragment CREATE VIEW Road_River_Cross_Geometry AS SELECT T.id as Road_Cross_RiverID, intersection ( T.the_geom, S.the_geom ) as Road_Cross_River FROM Road_Line_Table T, River_Area_Table S WHERE intersects ( T.the_geom, S.the_geom ) = true ; CREATE VIEW Roads_Crossing_River_Frequently AS SELECT R1.Road_Cross_RiverID AS Road_Cross_River_OutlierID, FROM Road_River_Cross_Geomtery R1, Road_River_Cross_Geometry R2 WHERE disjoint ( R1.Road_Cross_River, R2.Road_Cross_River) AND distance ( R1.Road_Cross_river, R2.Road_Cross_River ) < 0.001 ; CREATE TABLE Road_Crossing_River_Outlier AS SELECT DISTINCT T.* FROM Road_Line_Table T, Roads_Crossing_River_Frequently R WHERE T.id = R. Road_Cross_River_OutlierID;
Detecting Road Frequently Crossing River Spatial Query Performance • Machine used - 1.4 GHz Athlon with 512 MB RAM • Total execution time - 5 minutes
River Becoming Stream: Predicting Mislabeled Features • Streams usually become rivers but rivers rarely become streams unless a lake is nearby • River becoming a stream is a local spatial outlier Stream River
Detecting River Becoming Stream:Empirical Technique Used • Determine intersections of rivers and streams • If there are no lakes at distance less than 0.01 units near the intersection points classify the river feature as an outlier
Phase I Results • Demonstrated TopoAssistant feasibility • Implementation feasibility: Built prototype • Concept feasibility: Designed prototype evaluation methodology for TEC datasets • Concept feasibility: Applied spatial data mining techniques to • Detection of errors • Prediction of positional errors • Prediction of extra/erroneous/missing features • Prediction of mislabeled features • Feature attribution • Prediction of missing features • Identified technical challenges and Phase II approach for addressing them
Feature Attribution via Collocation • Motivation - Improve feature attribution by • Prediction of missing features • Approach - collocation patterns • Collocation patterns detected • Crop land/rice fields: ends of roads/cart roads/rivers/streams • Road collocated with river/stream
Detecting Collocation Patterns:Algorithmic Basis • To calculate the degree of collocation we use a measure called interest measures • E.g., 96.5 % of the cropland are close to road/river • Interest measure represents conditional probability i.e., is the probability of finding a road or river nearby, there being a cropland is 0.965 • Cropland not close to road/river may predict missing road or river feature • Cropland not close to road/river may also indicate positional error of cropland
Predicting Missing Features using Collocation Patterns • Cropland collocated with river, stream or road • May predict missing river, stream or road features River/stream Cropland Road Non collocated cropland
Spatial Outlier Detection using Collocation Patterns • Cropland collocated with river, stream or road • Cropland outlier may also predict positional error of cropland River/stream Cropland Road Croplandoutlier
Cropland/Road/River: Interest Measure • Total number of cropland features = 199 • Distance threshold = 0.001 • 96.5 % of all cropland features collocated with road or river
Cropland/Road/River Collocation Pattern:Technique Used • Cropland pattern detected using collocation pattern detection techniques • Step 1: Cropland areas collocated with cart road/road determined • Step 2: Cropland areas collocated with stream/river determined • Step 3: Cropland areas collocated with cart road/road or stream/river determined • Cropland outliers are cropland areas which are not collocated with either road, cartroad, stream or river features
Cropland/Road/River Collocation Pattern: Spatial Query Fragment CREATE TABLE Cropland_River_Collocate AS SELECT C.* FROM River_Area_Table R, Veg_Area_Table C WHERE (C.f_code_des = 'Cropland' AND distance ( C.the_geom,R.the_geom) < 0.01) OR (C.f_code_des = 'Rice Field' AND distance ( C.the_geom,R.the_geom)<0.01); CREATE TABLE Cropland_Stream_Collocate AS SELECT C.* FROM Stream_Line_Table R, Veg_Area_Table C WHERE ( C.f_code_des = 'Cropland' AND distance ( C.the_geom,R.the_geom) < 0.001) OR ( C.f_code_des = 'Rice Field' AND distance ( C.the_geom,R.the_geom) < 0.001) ; CREATE TABLE Cropland_Road_Collocate AS SELECT C.* FROM Road_Line_Table R, Veg_Area_Table C WHERE (C.f_code_des = 'Cropland' AND distance ( C.the_geom,R.the_geom) < 0.001) OR (C.f_code_des = 'Rice Field' AND distance ( C.the_geom,R.the_geom)<0.001); CREATE TABLE Cropland_Cartroad_Collocate AS SELECT C.* FROM Cartroad_Line_Table R, Veg_Area_Table C WHERE (C.f_code_des = 'Cropland' AND distance ( C.the_geom,R.the_geom) < 0.001) OR (C.f_code_des = 'Rice Field' AND distance ( C.the_geom,R.the_geom)<0.001);
Cropland/Road/River Collocation Pattern: Spatial Query Performance • Machine used - 1.4 GHz Athlon with 512 MB RAM • Total execution time - 13.5 minutes
Collocation Pattern: Roads with Rivers • Road collocated with river/stream • Pondering if it could be used to predict anything ? • May predict missing streams River/Stream Collocated Roads Non collocated Roads