Interactive Pie Charts Lesson for Students
160 likes | 221 Views
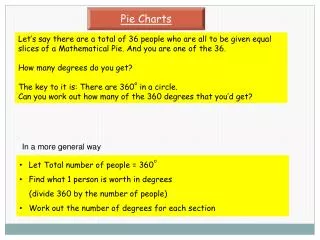
Learn how to create pie charts with step-by-step calculations and examples on students' preferences, transportation, work hours, club interests, factory production, and vehicle types. The lesson includes clear instructions and insights on data visualization techniques.

Interactive Pie Charts Lesson for Students
E N D
Presentation Transcript
Pie Charts Lesson
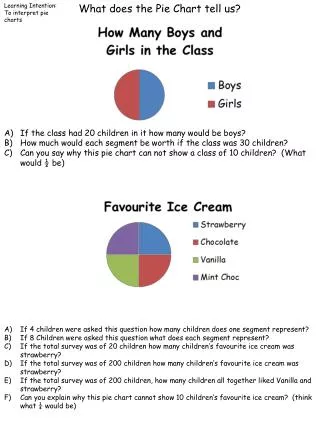
Survey of students favorite car Step 1Add up and get the totalStep 2number / total X 360 /20 X 360 = 36 /20 X 360 = 40 /20 X 360 = 180 /20 X360 = 50 / 20 X 360 = 18 20
Survey of students best food /60 X 360 = 126 /60 X 360 = 90 /60 X 360 = 36 /60 X360 = 84 / 60 X 360 = 24 60
360 children are asked how they come to school 360 / 360 = 1 120 90 70 50 30
Samiya's week at the office, 36 hours 17 30 70 2 20 50
What 72 children wanted to see in their Youth Club 360 / 72 = 5 15 45 10 40 60 18
Production of different cereals in a factory total 1080 kg 1080/360 = 3kg 270 40 180 50 20 300
60 vehicles are shown in this pie chart 360 degrees / 60 cars = 6 Therefore 1 vehicle = 6 degrees • Calculate the numbers of cars, vans, buses and lorries • State the mode type of vehicle Cars = 120 / 6 = 20 cars Vans = 90 / 6 = 15 Vans Buses = 60 / 6 = 10 Buses Lorries = 90 / 6 = 15 Lorries To check – 20 + 15 + 10 + 15 = 60 Vehicles Mode = Most Frequent