Download
1 / 19
260 likes | 1.15k Views
Health Impacts of Air Pollution in Los Angeles County. Los Angeles County Department of Public Health January 31, 2007. Los Angeles County.

E N D
Health Impacts of Air Pollution in Los Angeles County Los Angeles County Department of Public Health January 31, 2007
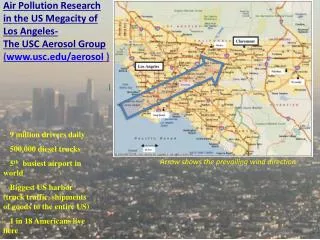
Los Angeles County • The 2006 State of the Air report published by the American Lung Association, ranked the Los Angeles metropolitan region as having the worst air in the country. • Between 1993 and 2003, the Southern California region, especially Los Angeles County, was consistently ranked as the most congested metropolitan region in the nation. (SCAG)
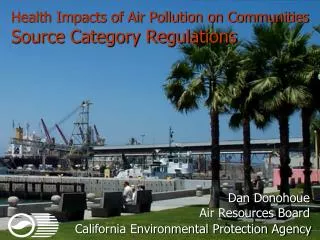
Sources of Air Pollution • Emissions from mobile sources such as cars, trucks, ships, trains, and airplanes. • Regulated by the California Air Resources Board • Emissions from stationary sources like office buildings, factories, and oil refineries • Regulated by the South Coast Air Quality Management District
Pollutants Examples of Sources Particulate Matter Emissions from cars and trucks, especially diesel Ozone (O3) Emissions from motor vehicles, industries, and consumer products. Carbon Monoxide (CO) & Nitrogen Dioxide (NO2) Any source that burns fuel such as cars, trucks, construction and farming equipment and residential heaters and stoves. Toxic Air Contaminants Emission from cars, trucks; industrial sources; local businesses (dry cleaners, service stations, etc.); and building material and products. Common Air Pollutants California Air Resources Board Fact Sheet: Air Pollution and Health
Lung damage/ stunted lung development Premature Death Cancer Respiratory diseases, including asthma Air Pollution Chronic eye, lung, or skin irritation Premature births Development of cardiovascular diseases (heart disease and stroke) Health Effects of Air Pollution
USC Study- January 2007 Children who live near a major highway are not only more likely to develop asthma or other respiratory diseases, but their lung development may also be stunted.
Health and Economic Impact(per year in California) • Premature Deaths (6,500) • School Absences (1,300,000) • Lost Workdays (2,800,000) Respiratory Illness, including Asthma (1,700,000) Hospitalizations due to respiratory illness (9,000) Lungs of a non-smoker as affected by air pollution (AQMD) “Recent Research Findings: Health Effects of Particulate Matter and Ozone Air Pollution,” California Air Resources Board, January 2004
Contributing factors to air pollution in Los Angeles County • Automobile dependency • Urban sprawl • Commuting • Congestion
Automotive Dependency In 2005, the Southern California metropolitan region was ranked: • Third highest forhousehold vehicle ownership (93 %) • Third highest for number of vehicles per household (1.71) • Second highest for number of vehicles per worker • Third lowest for share (4.5%) of workers using transit to get to work
Urban Sprawl • The high price of homes in Los Angeles County has fueled the growth of bedroom communities so that commuting 2hours or more each way has become routine. • In 2000, 1in every 17 people living in the United States called Southern California home. (Southern California Associations of Governments) • The Los Angeles region is expected to increase by 6million by the year 2030. (SCAG)
Commuting • Los Angeles has the nation's worst Travel Time Index (TTI), 1.75 -- driving times during peak traffic hours are 75% longer than during off-peak times. (SCAG) • According to national statistics, Los Angeles is among the top 10 U.S. cities with the most long-distance commuters. (LA Times, September 2006) • Commuters spend 93 hours in rush-hour commuter traffic. (Texas Transportation Institute)
Congestion • The Southern California region has about 14 million vehicles and almost all daily trips (99%) rely on the freeway and arterial network in the region. • In 2003, the total cost incurred due to congestion was almost $11 billion, significantly higher than any other metropolitan region in the nation. State of the Region, Southern California Association of Governments, 2005.
Why a public transportation incentive? • Largest employer in the county (over 95,000 employees) • Employees live and work across the Southern California region • Employee wellness • Set an example for other governments and businesses in the region • Attract quality recruits to the County • Comply with AQMD Rule 2202
Benefits of Public Transportation • Economic • Energy Saving • Physical Environment • Social Environment
Economic • In 2003, the average transportation expenditures for a median income household in the US is 19.1% of income, second only to housing expenditures. (Housing & Transportation Affordability Index) • Using public transportation slashes household expenses by an average $6,200 -- more than the average household pays for food for an entire year ($5,781). (American Public Transportation Association, January 2007)
Energy Saving Public transportation use reduces gasoline consumption in the United States by an estimated 1.4 billion gallons annually (the equivalent of almost 300,000 cars filling up each day). (ICF International, 2007) • Public transportation uses less than 1% of the energy consumed in this country. (SCAG) • Fully loaded rail cars are 15 times more fuel-efficient than single occupant automobiles. (SCAG)
Physical Environment • Although air quality has improved, Southern California still experiences 5,400 premature deaths a year because of air pollution. (LA Times, January 20, 2007) • People who commute via public transportation can get 30 minutes of daily physical activity. (Center for the Advancement of Health) • Customers commuting by train are 15 times safer than those traveling by car. (National Safety Council)
Social Environment • Public transportation revitalizes neighborhoods, increases social interaction and pedestrian activity, and helps create a sense of "place.“ (APTA) • More than 50 % of all non-drivers age 65 and older - or 3.6 million Americans - stay at home on any given day partially because they lack transportation options. (APTA) • Public transportation increases mobility for low-income households. (Center for Transportation Excellence)