NETWORKS BASICS
NETWORKS BASICS Danail Bonchev Center for the Study of Biological Complexity Virginia Commonwealth University Singapore, July 9-17, 2007 Recommended Literature 1. Linked: The New Science of Networks. Albert-László Barabási.

NETWORKS BASICS
E N D
Presentation Transcript
NETWORKS BASICS Danail Bonchev Center for the Study of Biological Complexity Virginia Commonwealth University Singapore, July 9-17, 2007
Recommended Literature • 1. Linked: The New Science of Networks. Albert-László Barabási. • Perseus Publisher, 2002. ISBN: 0-738-20667-9, 304 pp., Price: $ 15.00 • The Structure and Dynamics of Networks. Mark Newman, Albert-László • Barabási, and Duncan J. Watts, Princeton University Press, 2006 • | $49.50 / ISBN: 0-691-11357-2; 624 pp. • 3. Evolution of Networks. From Biological Nets to the Internet and WWW. • Serguei N Dorogovtsev, Jose Fernando Ferreira Mendes, and A F Ioffe • Oxford University Press, 2003, ISBN: 0198515901, $95.00, 344 pp. 4. An introduction to Systems Biology: Design Principles of Biological Circuits,Uri Alon,Chapman & Hall/CRC, Taylor and Francis Group, 2006,ISBN:1584886420.
Systems Biology. What Is It? • A branch of science that seeks to integrate different levels of information to understand how biological systems function. • L. Hood: “Systems biology defines and analyses the interrelationships of all of the elements in a functioning system in order to understand how the system works.” • It is not the number and properties of system elements but their relations!!
The Goal of Systems Biology: To understand the flow of mass, energy, and information in living systems. More on Systems Biology Essence of living systems is flow of mass, energy, and information in space and time. The flow occurs along specific networks • Flow of mass and energy (metabolic networks) • Flow ofinformation involving DNA (transcriptional • regulationnetworks) • Flow of information not involving DNA (signaling networks)
Networks and the Core Concepts of Systems Biology • Complexity emerges at all levels of the • hierarchy of life • System properties emerge from interactions • of components (iii) The whole is more than the sum of the parts. (iv) Applied mathematics provides approaches to modeling biological systems.
How to Describe a System As a Whole? Networks - The Language of Complex Systems
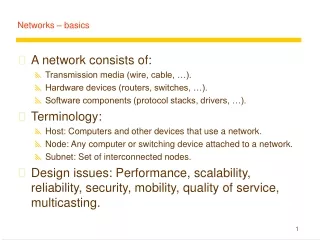
What is a Network? Network is a mathematical structure composed of points connected by lines Network Theory<-> Graph Theory Network Graph Nodes Vertices (points) Links Edges (Lines) F. Harary, Graph Theory, Addison Wesley, Reading, MA, 1969 Gross & Yellen, Handbook of Graph Theory, CRC Press, Boca Raton, FL, 2004 A network can be build for any functional system System vs. Parts = Networks vs. Nodes
1 2 3 4 5 6 2.5 12.7 7.3 3.3 5.4 8.1 2.5 Vertex-Weighted Edge-Weighted Networks As Graphs • Networks can be undirected or directed, depending on whether • the interaction between two neighboring nodes proceeds in both • directions or in only one of them, respectively. • The specificity of network nodes and links can be quantitatively • characterized by weights
A network can be connected (presented by a single component) or • disconnected (presented by several disjoint components). connected disconnected trees cyclic graphs Networks As Graphs - 2 • Networks having no cycles are termed trees. The more cycles the • network has, the more complex it is.
Paths Stars Cycles Complete Graphs Bipartite Graphs Networks As Graphs - 3 Some Basic Types of Graphs
Fragment of a Social Network (Melburn, 2004)
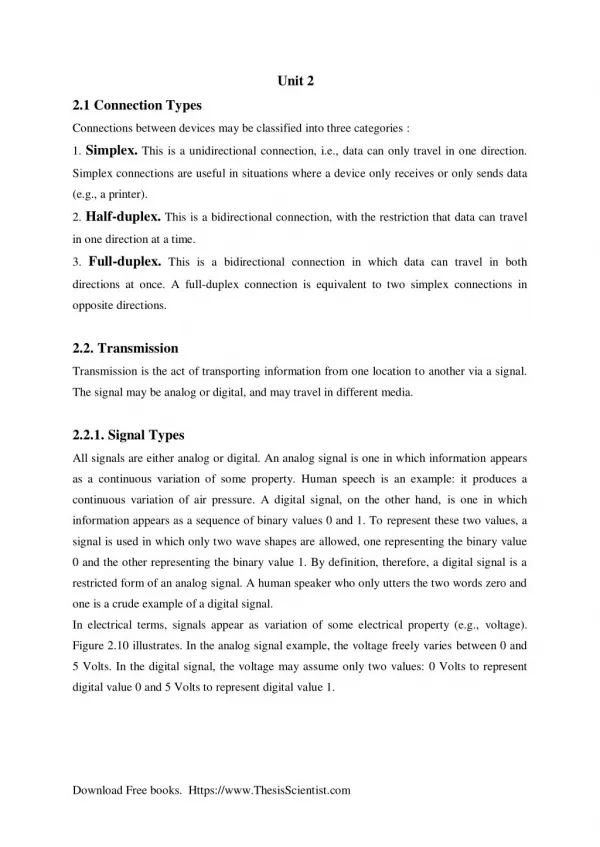
A. Intra-Cellular Networks Protein interaction networks Metabolic Networks Signaling Networks Gene Regulatory Networks Composite networks Networks of Modules, Functional Networks Disease networks B. Inter-Cellular Networks Neural Networks Biological Networks C. Organ and Tissue Networks D. Ecological Networks E. Evolution Network
Bio-Map L-A Barabasi protein-gene interactions PROTEOME protein-protein interactions METABOLISM Bio-chemical reactions Citrate Cycle GENOME miRNA regulation? _ _ _ _ _ _ _ _ _ _ _ _ _ _ _ _ _ _ _ _ _ - -
The Protein Network of Drosophila CuraGen Corporation Science, 2003
Metabolic Networks Source: ExPASy
Cleavage of Caspase Substrates CASP6 DISC CASP10 Heterodimer DFF FADD FAS-L FAS-R CASP3 Death activator DFF45 DFF40 CASP8 Death-Inducing Signaling Complex CASP7 Initiator Caspases Start DNA Fragmentation Executor Caspases Apoptosis Pathway - 1 Apoptosis is a mechanism of controlled cell death critically important in many biological processes Membrane protein D. Bonchev, L.B. Kier, C. Cheng, Lecture Serieson Computer and Computational Sciences 6, 581-591 (2006).
The Longevity Gene-Protein Network (LGPN) C. elegans T. Witten, D. Bonchev, in press
Network of Interacting Pathways (NIP) 381 organisms A.Mazurie D.Bonchev G.A. Buck, 2007
Cell Cycle Cell Polarity & Structure 7 Number of protein complexes 13 111 8 61 25 40 Number of proteins Transcription/DNA Maintenance/Chromatin Structure 77 19 15 Number of shared proteins 14 11 7 30 16 27 22 Intermediate and Energy Metabolism 187 55 740 43 221 94 33 73 83 37 103 65 11 Signaling Membrane Biogenesis & Turnover 13 20 125 20 147 53 35 321 19 41 299 49 596 75 97 Protein Synthesis and Turnover 28 692 33 419 RNA Metabolism 260 24 172 75 12 160 Protein RNA / Transport Functional Networks Yeast: 1400 proteins, 232 complexes, nine functional groups of complexes (Data A.-M. Gavin et al. (2002) Nature 415,141-147) D. Bonchev, Chemistry & Biodiversity 1(2004)312-326
Summary • All complex networks in nature and technology have common features. • They differ considerably from random networks of the same size • By studying network structure and dynamics, and by using comparative network analysis, one can get answers of important biological questions.
Fundamental biological questions to answer: (i) Which interactions and groups of interactions are likely to have equivalent functions across species? (ii) Based on these similarities, can we predict new functional information about proteins and interactions that are poorly characterized? (iii) What do these relationships tell us about the evolution of proteins, networks and whole species? (iv) How to reduce the noise in biological data: Which interactions represent true binding events? False-positive interaction is unlikely to be reproduced across the interaction maps of multiple species. Fundamental Biological Questions to Answer (i) Which interactions and groups of interactions are likely to have equivalent functions across species? (ii) Based on these similarities, can we predict new functional information about proteins and interactions that are poorly characterized? (iii) What do these relationships tell us about the evolution of proteins, networks and whole species? (iv) How to reduce the noise in biological data: Which interactions represent true binding events? False-positive interaction is unlikely to be reproduced across the interaction maps of multiple species.
All Complex Dynamic Networks Have Similar Structure and Common Properties • Hubs • Scale-Freeness • Small-Worldness • Centrality • Robustness/Fragility
How To Characterize a Network?
Quantifying Networks A. Graph-Theoretical (Topological) Descriptors A1. Connectivity-based: A2. Distance-based B. Information-Theoretic Descriptors B1, Compositional B2. Structural C. Complexity Measures C1. Subgraph Count C2. Overall Connectivity C3. Walk Count C4. Small-World Connectivity
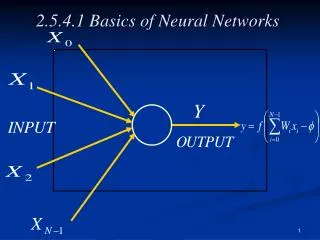
1 V = 5 E = 4 G random node numbering Adjacency Matrix 2 3 4 5 1 2 3 4 5 ai 1 0 0 1 0 0 1 0 0 1 0 0 1 1 1 0 1 0 3 0 0 1 0 1 2 0 0 0 1 0 1 1 2 3 4 5 A(G) = 1 3 2 1 node degrees ai – node degree Connectivity-Based Topological Descriptors Adjacency Matrix Adjacency relation, aij aij= 1 (neighbors) aij= 0 (otherwise)
Connectivity Descriptors Local (node) descriptors: vertex (node) degrees, ai Global (Network) descriptors: total adjacency, A
Average vertex (node) degree: Network connectedness (density) Example A = 1+1+3+2+1 = 8 1 <ai> = 8/5 = 1.6 Conn = 8/5.4 = 0.4 = 40% 1 3 2 1 Connectivity Descriptors-2 Average and Normalized Descriptors
1 In-degree = -1 Out-degree = +1 2 3 4 5 1 2 3 4 5 ai(out) 0 0 1 0 0 +1 0 0 1 0 0 +1 1 0 0 0 0 +1 0 0 1 0 0 +1 0 0 0 1 0 +1 ai(in) -1 0 -3 -1 0 1 2 3 4 5 A(DG) = -1,1 0,1 -3,1 -1,1 0,1 Adjacency in Directed Graphs Adjacency relation, aij aij = -1 (incoming edge(arc)) aij = +1 (outgoing edge(arc)) aij = 0 (otherwise)
1 2 3 4 5 6 1 2 3 4 5 di 7 0 2 1 2 3 8 2 0 1 2 3 8 1 1 0 1 2 5 2 2 1 0 1 6 3 3 2 1 0 9 1 2 3 4 5 2 3 D(G) = 4 5 d26 = ? d57 =? Distance-Based Topological Descriptors Distance Matrix Distance relation: dij = 1 for i,j - neighbors The distance between two non-neighboring nodes is equal to the number of edges along the shortest path that connects them. di – node distance (node distance degree)
node distance, di ei = Max(dij) Node eccentricity, ei Network distance, D(G) Network diameter,Diam(G) Network radius, Rad(G) Distance Descriptors Node descriptors: Network descriptors:
Average node distance, <di> Average network distance, <d> (average degree of separation, average path length) Example 8 D = 8+8+5+6+9 = 36 <di> = 36/5 = 7.2 8 5 6 9 <d > = 36/5.4 = 1.8 Distance Descriptors-2 Average and Normalized Descriptors
1 2 3 4 0,3 • Some distances in directed graphs are equal to infinity !! -2,1 How to calculate D and <d>? 0, 2 -4, 0 Distances in Directed Networks • In-distances and out-distances D(in) = D(out) = 6 <d> = 6/(4x3) = 0.5 ??? d21=? d13=?
Adjusted Average Network Distance Example: 9 9 8 Acc (G) = Nd(DG)/Nd • Network Node Accessibility 8 7 1 0 6 8 12 G DG 9 9 D = 52, <d(G)> = 52/(6x5) = 1.73 D = 34, <d(DG)> = 34/20 = 1.70 < D(G)?? Distances in Directed Networks - 2 AC = 20/30 = 0.667 AD = 1.70/0.667 = 2.55 > D(G)
The more diverse the distribution of system elements, the larger its • information content. Information is a measure of system’s diversity • The more complex the system, the larger its information content. Information is a measure of system complexity Shannon’s Information Theory • What Is Information? Wiener: Information is neither matter, nor energy. • How to Measure Information? Forget about meaning! Information is contained in any system, the elements of which can be grouped according to one or more criteria. References 1. Shannon, C.; Weaver, W. Mathematical Theory of Communications.University of Illinois Press: Urbana, MI, 1949. 2. Bonchev, D. Information‑Theoretic Indices for Characterization of Chemical Structures. Research Studies Press: Chichester, UK,1983.
Mean Information: , bits/element Total Information: , bits Normalized Information: Shannon’s Information Theory Basic Equations Finite Probability Scheme: System of N elements and k equivalence classes with equivalence criterion α: class number of elements probability 1N1p1 2 N2p2 ………………………………………………………………... k Nkpk where pi = Ni / N, and Σ pi = 1.
degrees 9 distances 8 eI(deg) = - 2x(2/6)log2(2/6) – 2x(1/6)log2(1/6) = 1.92 bits/node 6 8 12 9 eItot(dist) = 6log26 – 2x2log22– 2x1log1 = 11.51 bits 2 eI (deg) =11.51/(6log26) = 0.742 4 3 2 1 2 Network Information Descriptors • Information on the system elements equivalence, eI Vertex degree equivalence distribution: 6{3, 1, 1, 1} eI(deg) = -(3/6)2log(3/6) – 3x(1/6)log2(1/6) = 1.79 bits/node eItot(deg) = 6log26 – 3log23– 3x1log1 = 10.75 bits eInorm(deg) =10.75/(6log26) = 0.693 Vertex distance equivalence distribution: 6{ 2, 2, 1, 1} Composition distribution: 6{2,2,1,1}
mI(deg) = -(4/14)log2(4/14) –(3/14)log2(3/14) – 3x(2/14)log2(2/14) – (1/14)log2(1/14) = 2.47 bits/node degrees mItot(deg) = 14log214 – 4log24– 3log23 -3x2log22 -1log21 = 34.55 bits mInorm(deg) =34.55/(14log214) = 0.648 A = 14 9 distances mI(deg) = -(12/52)log2(12/52) – 2x(9/52)log2(9/52) – 2x(8/52)log2(8/52) – (6/52)log2(6/52) = 2.55 bits/node 8 6 8 12 2 D = 52 9 4 mInorm(deg) =132.83/(52log252) = 0.448 3 2 1 2 mI(dist) = 52log252–12log212–2x9log29–2x8log28-6log26 = 132.83 bits Network Information Descriptors - 2 Information on the system elements weight (or magnitude) , mI weighted information descriptors (indices) Vertex degree distribution: 14 {4, 3, 3x2, 1} Distance magnitude distribution: 52 {12, 2x9, 2x8, 6}
Network Complexity Descriptors - 1 1 1 1 1 1 1 1 3 3 3 3 2 2 2 2 1 1 1 1 1 3 Example V = 5, E = 4 e = number of edges 1 3 e=0 0SC = 5 0OC =8 e=1 1SC = 4 1OC = 16 1 3 3 2 2 1 1 1 3 2SC = 4 2OC = 23 e=2 1 2 1 3 3 2 3 2 1 2 3SC = 3 3OC = 21 e=3 4SC=1 4OC = 8 e=4 Subgraph Count, eSC Overall Connectivity, eOC SC = 17 (5, 4, 4, 3, 1) OC = 76 ( 8, 16, 23, 21, 8)
Network Complexity Descriptors - 2Walk Count, WC 2 Example 1 3 4 5 l=2 l = 1 l=2 1 3 1 2 1 3 1 3 4 • The three complexity measures, SC, OC, and WC, • can discriminate very subtle complexity features. SC28(5,8,9,5,1) 30(5,9,10,5,1) OC(in)111(12,28,41,25,5) 135(16,40,49,25,5) WC 15(5,5,5) 21(5,7,9) WC = 106 ( 8, 16, 28, 54) • For networks use only complexity measures with e = 1, 2, and 3!!
Network Complexity Descriptors - 3 Small-World Connectivity • Network complexity increases with connectivity • Network complexity increases with the decrease in its radius • Can one unite the two patterns into a single complexity measure? bi is a measure for node centrality D. Bonchev and G. A. Buck, Quantitative Measures of Network Complexity. In: Complexity in Chemistry, Biology and Ecology, D. Bonchev and D. H. Rouvray, Eds., Springer, New York, 2005, p. 191-235.
6 3 5 7 9 8 10 SC = 29 31 54 57 OC = 190 212 482 522 WC = 178 214 300 350 B1 = 0.313 0.313 0.429 0.400 B2 = 1.6774 1.783 2.200 2.211 11 13 14 15 12 Examples of Increasing Complexity: N = 5 4 SC = 11 17 20 26 OC = 32 76 100 160 WC = 58 106 140 150 B1 = 0.2 0.222 0.250 0.333 B2 = 1.105 1.294 1.571 1.6667 SC = 61 114 119 477 973 OC = 566 1316 1396 7806 18180 WC = 337 538 638 1200 1700 A/D = 0.429 0.538 0.538 0.818 1 B2 = 2.410 2.867 2.943 4.200 5
Thank You for Your Attention!!!