Download
1 / 23
240 likes | 536 Views
Infrasonic Signal Detection Using The Hough Transform. D. J. Brown, B.L.N. Kennett, C. Tarlowski Research School of Earth Sciences, Australian National University, Canberra, 0200, Australia. Overview. Motivation The Hough Transform Three-Dimensional array processing

E N D
Infrasonic Signal Detection UsingTheHough Transform D. J. Brown, B.L.N. Kennett, C. Tarlowski Research School of Earth Sciences, Australian National University, Canberra, 0200, Australia
Overview • Motivation • The Hough Transform • Three-Dimensional array processing • ‘INFER’ detector design • Examples • Summary
Motivation • Based on the premise that signal duration may be a significant discriminant • a signal with an extended duration is at least indicative that ‘something’ is happening ‘somewhere’ • Infrasonic detection algorithms with an ‘instantaneous’ detection philosophy will likely never operate at sufficiently low thresholds to detect all significant signals • e.g., a pure Fstat-detector cannot reasonably operate with the detection threshold set much below 6. • traditionally a threshold is set and signal duration is defined by how long the signal stays above threshold. • It remains to obtain a correct measure of signal duration
Motivation Etna Volcano • Acoustic signal from Etna volcano recorded at I26DE • a significant signal • Distinct lack of • correlation • amplitude • Average Fstat around 4.3 • Only two integration intervals with Fstats > 6 • Using a pure Fstat detector, measuring signal duration based on above-threshold-time-durations will yield very short signal durations • Signal presence is obvious to the human eye by the dominant azimuth and trace velocity [I26DE, Freyung, Germany]
Motivation STS-96 • Acoustic signal from shuttle launch STS-96 recorded at DLIAR, Los Alamos • a significant signal • Distinct lack of • correlation • amplitude • Average Fstat around 4.3 • Maximum Fstat ~ 6 • Using a pure Fstat detector, determining signal duration based on above threshold time durations will yield very short signal durations • Signal presence is obvious to the human eye due to the dominant azimuth and trace velocity [DLIAR, Los Alamos]
Motivation • Need to design a detection strategy based on the persistence of the measured backazimuth during the passage of the signal • Certain tools in Pattern Recognition theory may be useful • Envisage a detection algorithm that • has two parts: • parameter extraction over short time intervals. • seeks regions of persistent backazimuth, regardless of any threshold parameter. • Thresholding • since the short duration industrial-type signals are more prevalent than the longer duration signals of interest, and generally not as important, define a set of signal duration thresholds that may be frequency band-dependent. • Uses 3D array geometry
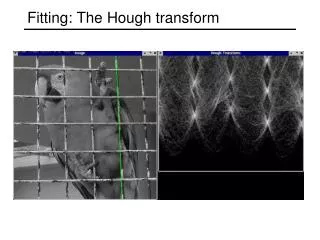
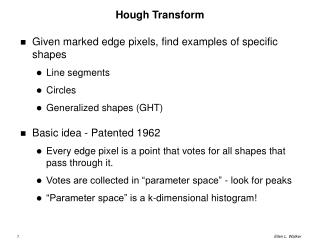
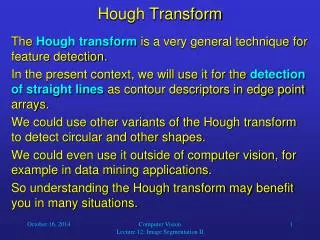
The Hough Transform • method for doing pattern recognition • extracts parametric curve information from binary pixelated data in the presence of noise • consider binary image data: • apply the transformation: • maps points in S into lines in parameter space, P • all points on the same line in S have the same intersection point in P • Pairs of points (xiyi),(xj,yj) in S are mapped to the point (m,t)in P where • Problem of detecting spatially extended lines becomes one of finding a local maximum
The Hough Transform Image Space, S Parameter Space, P Hough Transform
The Hough Transform Image Space, S Parameter Space, P STS-96 Hough Transform [DLIAR, Los Alamos]
INFER Detector Design (I) • Detection philosophy: • measure accurately: • signal duration • arrival time • backazimuth • one single detection per phase • relieves the burden on down-stream processing • does away with the infrasonic ‘coda’ phase
INFER Detector Design (I) • Two stage detection process • signal parameter estimation in 3D • delay-and-sum correlation (in use) • global minimization of the mis-match between theoretical and stacked trace beam powers (presently testing -see Poster) • maximum beam-power by contracting grid (presently testing -see Poster) • Signal detection via the Hough Transform • to prevent spurious associations between pairs of points, define a maximum time separation that can exist between any pair of points. • define an accumulator mesh whose granularity is commensurate with the uncertainty in the measured azimuth. • keep track of the features of all integration intervals that contributed to any one accumulator cell..
INFER Detector Design (II) • Phase Identification • may need to decide phase during source location • Basic nomenclature: • Thresholding for detection • signal duration dependent thresholds • Fstat • STA/LTA • take the STA interval to be the entire integration interval • take the LTA interval to be the entire time-block requested • various norms: L1, L2 integrated power • signal duration
INFER Detector Design (III) • Thresholds • signal duration dependent • processing frequency-band dependent
3D Array Processing • Jin Wang (1999) shows that significant vertical sensor separations can strongly influence: • measured backazimuth • magnitude slowness • beam power • We extend slowness plane to 3rd dimension: (sx,sy,sz) • Create a mesh in the 3D half-space • Consider only those points that lie in an e thick dome centered on the acoustic slowness. • [Recently] Use e = 0 ! • Use Cs determined by • Value of Temperature recorded at the array • climatological model • Constant = 330 m/s e |s| = 1/Cs
Results Shuttle launch signal -DLIAR
Results Gas pipeline explosion -DLIAR
Results Seattle Earthquake -I10CA
Results Acapulco Bolide -I59US
Results Etna volcano -I26DE
Summary • Detecting infrasound signals from IMS array data by seeking regions of constant backazimuth seems to be a robust procedure • backazimuth can be accurately determined • signal duration can be accurately inferred • The Hough Transform can be used quite effectively to look for regions of constant backazimuth • signals with moderate to small Fstat can be detected • An automatic signal detection algorithm called INFER based on the Hough Transform has been created • uses 3D array geometry • uses correlator to do feature extraction • testing other procedures • incorporates basic phase id • interfaces dynamically with the CSS database tables