Download
1 / 51
630 likes | 1.17k Views
Transport Modelling – An overview of the four modeling stages. Lecture covers. Travel demand modeling concepts Four stage TDM Explanation Data requirements Forecasting. TRAVEL DEMAND ANALYSIS; MODELLING AND FORECASTING. The Four Stage TDM. The fours step process.

E N D
Transport Modelling– An overview of the four modeling stages
Lecture covers • Travel demand modeling concepts • Four stage TDM • Explanation • Data requirements • Forecasting
Key Concepts in transportation planning Model • Long-run decrease in friction of distance Interaction t2 t3 t1 Distance Due to innovations in transportation methods and improvements in media themselves Result: Lowered average ton-mile costs of transportation and decreased importance of transport costs as a factor cost AND other costs rise in importance
Four basic elements of the urban transportation forecasting process
Comprehensive Transportation Planning Dimensions • Economic • Social • Environmental
TRAVEL DEMAND MODEL Land use Travel behavior T System performance Why Use Travel Demand Models • A relationship between transport system and indicators • Access • Purpose • Frequency • Use
Economic, Social, and Environmental Dimensions • Where do they come in to this process? TRAVEL DEMAND MODEL Evaluate progress to goal Indicators System performance Other data
Residential Employment Residential Employment Service Service …through performance indicators • For example: • Commute speed • Land use mix • Transport diversity • Transport equity
Example • Model output = travel times between all points • Indicator: Commute speed • Indicator: Land use mix • Indicator: Transport diversity • Indicator: Equity
Introduction to Travel Demand Modeling • What is a travel demand model • Assignment: Discuss your knowledge • Input data • Trip generation • Trip distribution • Mode choice • Traffic/trip assignment
Demographic Data Step 1: Trip Generation Transportation Network Step 2: Trip Distribution Step 3: Mode Choice Step 4: Trip/ Traffic Assignment Four Step Travel Demand Model (FSTDM)
Trip Generation Questions • How much do people use the transport system? • Why do people use the transport system? • Where can different types of activities be satisfied?
Cross Classification Model Number of trips by household classifications or grouping
Trip Distribution Questions • Given a location, where do people go to satisfy demand for an activity type?
a Aj / Cij Trip Distribution Models You can consider this as the probability spatial distribution P(Tj) • Gravity Model • Tij = Ti • Tij = trips from zone i to zone j • Ti = total trips originating at zone i • Aj = attraction factor at j • Ax = attraction factor at any zone x • Cij = travel friction from i to j expressed as a generalized cost function • Cix = travel friction from i to any zone x expressed as a generalized cost function • a = friction exponent or restraining influence a Sum (Ax / Cix)
Destinations Origins 1 2 3 4 5 6 Sum T11 T12 T13 T14 T15 T16 O1 T21 T22 T23 T24 T25 T26 O2 T31 T32 T33 T34 T35 T36 O3 T41 T42 T43 T44 T45 T46 O4 T51 T52 T53 T54 T55 T56 O5 T61 T62 T63 T64 T65 T66 O6 D1 D2 D3 D4 D5 D6 1 2 3 4 5 6 Sum O - D Matrix Example:
What is modal split? • Split trips to different available transportation modes, by analyzing people’s decisions regarding mode of travel they use. Can be done here Trip-end models vs. Trip-interchange models
Mode choice Questions • How do people use the transport system? • What modes do they choose? • How do they react to varying transport service quality?
What affects people’s mode choice? Characteristics of the trip: trip distance, time of day, trip purpose Characteristics of the trip maker: Income, # of autos available, family size, residential density, gender Characteristics of the transportation system: riding time, waiting time, transfers, out-of-pocket cost
Direct-generation usage models (Trip-end models) Generate trips for transit and highway users separately meaning transit users use only transit (“captive” users). Used for small communities or in developing countries where ridership is primarily a function of socioeconomic variables
Direct-generation usage models (Trip-end models) (cont) Same categories but different trip rates Or, use separate models, like: P(T) = A + B(POP) – C(INC) P(A) = A + B (POP) – C(AUTO) Advantage: Simplicity Disadvantage: Cannot reflect “change of mind” of trip makers responding to policy and service changes
Trip-interchange models Influencing all three phases. Trip-interchange models are used AFTER the trip distribution phase.
Trip-interchange models (cont) Competing modes Because trip-interchange models are used after trip distribution, they can utilize the service characteristics of the modes available for the given trip, along with any relevant socioeconomic characteristics to determine the modal splits. This is the preferred and overwhelmingly typical approach for urban areas in which significant transit service exists and in which the “competition” between auto, transit, and other modes of travel must be explicitly considered.
Trip-interchange models (cont) Let’s see how service and trip makers characteristics can affect the trip maker’s decision using Fig. 11-11. • In-vehicle time (Auto – Transit) = -15 min • Out of pocket cost (Auto – Transit) = 25 cents • Excess time (Auto – Transit) = 3 min • If so, 37% of trips will be made by transit. Looks like a logit curve…
Use of logit models for modal choice (“Disaggregate, random utility modal choice model”) The logit model trades off the relative utilities of various modes. “The better a mode is, the more utility it has for the potential user” (See Examples 11& 12)
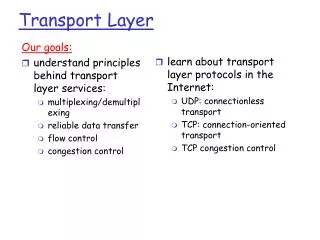
Trip / Traffic Assignment Questions • How do people use the transport system? • Given a mode, which route do they choose? • Do they satisfy multiple activities in one tour? • Which parts of the transport system do they use? • How do they react to varying transport service quality?
Network Level of Service • Highway • Travel distance ij • Travel time ij • Travel Cost • Transit • Walk time ij • First wait ij • In-vehicle time ij • Transfer time ij • Fare ij • Number of transfers • Drive access areas • Walk access areas
Demographic Data • Autos per household • Income level • Household size
Network Data • Highway network • Transit network • Graph
Carbon Monoxide Concentrations Projected for December 1995