Regression Model Building
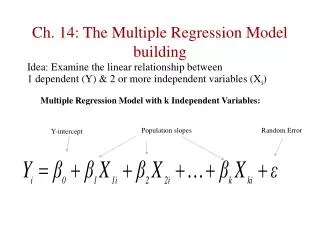
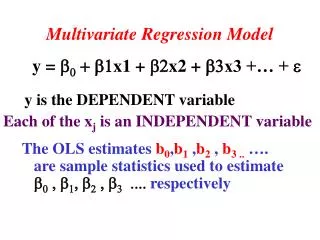
Regression Model Building. Predicting Number of Crew Members of Cruise Ships. Data Description. n=157 Cruise Ships Dependent Variable – Crew Size (100s) Potential Predictor Variables Age (2013 – Year Built) Tonnage (1000s of Tons) Passengers (100s) Length (100s of feet) Cabins (100s)

Regression Model Building
E N D
Presentation Transcript
Regression Model Building Predicting Number of Crew Members of Cruise Ships
Data Description • n=157 Cruise Ships • Dependent Variable – Crew Size (100s) • Potential Predictor Variables • Age (2013 – Year Built) • Tonnage (1000s of Tons) • Passengers (100s) • Length (100s of feet) • Cabins (100s) • Passenger Density (Passengers/Space)
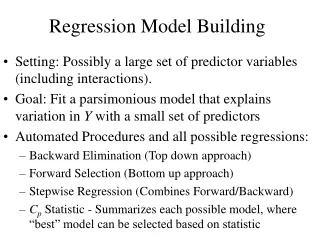
Summary of Automated Models • Backward Elimination • Drop Passenger Density (AIC drops from 1.055 to -0.943) • Drop Age (AIC drops from -0.943 to -2.062) • Stop: Keep Tonnage, Passengers, Length, Cabins • Forward Selection • Add Cabins (AIC drops from 397.18 to 28.82) • Add Length (AIC drops from 28.82 to 9.8661) • Add Passengers (AIC drops from 9.8661 to -0.0565) • Add Tonnage (AIC drops from -0.0565 to -2.06) • Stop: Keep Tonnage, Passengers, Length, Cabins • Stepwise – Same as Forward Selection
All Possible (Subset) Regressions (Best 4 per Grp) BIC Adj-R2 Cp
Cross-Validation • Hold-out Sample (Training Sample = 100, Validation = 58) • Fit Model on Training Sample, and obtain Regression Estimates • Apply Regression Estimates from Training Sample to Validation Sample X levels for Predicted MSEP = sum(obs-pred)2/n • Fit Model on Validation Sample and Compare regression coefficients with model for Training Sample • PRESS Statistic (Delete observations 1-at-a-time) • Fit model with each observation deleted 1-at-a-time • Obtain Residual for each observation when it was deleted • PRESS = sum(obs-pred(deleted))2 • K-fold Cross-validation • Extension of PRESS to where K groups of cases are deleted • Useful for computationally intensive models (not OLS)
Hold-Out Sample – nin = 100 nout = 58 Coefficients keep signs, but significance levels change a lot. See Tonnage and Length.
PRESS Statistic Model appears to be valid, very little difference between PRESS/n and MS(Resid)