Regression Model Building - Diagnostics
Understand the partial relation between response and a predictor with the added variable plot. Learn to control for other predictors and interpret the form of the relation between X and Y. Identify influential cases and address multicollinearity issues in regression modeling.


Regression Model Building - Diagnostics
E N D
Presentation Transcript
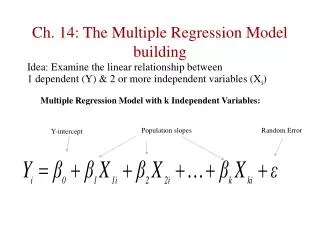
Regression Model Building - Diagnostics KNNL – Chapter 10
Model Adequacy for Predictors – Added Variable Plot • Graphical way to determine partial relation between response and a given predictor, after controlling for other predictors – shows form of relation between new X and Y • May not be helpful when other predictor(s) enter model with polynomial or interaction terms that are not controlled for • Algorithm (assume plot for X3, given X1, X2): • Fit regression of Y on X1,X2, obtain residuals = ei(Y|X1,X2) • Fit regression of X3 on X1,X2, obtain residuals = ei(X3|X1,X2) • Plot ei(Y|X1,X2) (vertical axis) versus ei(X3|X1,X2) (horizontal axis) • Slope of the regression through the origin of ei(Y|X1,X2) on ei(X3|X1,X2) is the partial regression coefficient for X3
Outlying X-Cases – Hat Matrix Leverage Values Cases with X-levels close to the “center” of the sampled X-levels will have small leverages. Cases with “extreme” levels have large leverages, and have the potential to “pull” the regression equation toward their observed Y-values. Large leverage values are > 2p/n (2 times larger than the mean) New cases with leverage values larger than those in original dataset are extrapolations
Multicollinearity - Variance Inflation Factors • Problems when predictor variables are correlated among themselves • Regression Coefficients of predictors change, depending on what other predictors are included • Extra Sums of Squares of predictors change, depending on what other predictors are included • Standard Errors of Regression Coefficients increase when predictors are highly correlated • Individual Regression Coefficients are not significant, although the overall model is • Width of Confidence Intervals for Regression Coefficients increases when predictors are highly correlated • Point Estimates of Regression Coefficients arewrong sign (+/-)