Download
1 / 17
170 likes | 184 Views
Explore the process of constructing color images in astronomy using black and white data. Learn about the charge-coupled device for optical images and how to stretch and map data for colorization. This lecture also covers the electromagnetic spectrum and upcoming topics in the course.

E N D
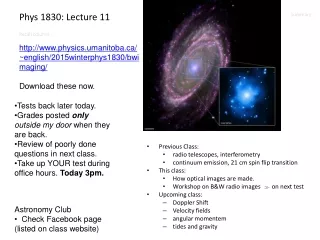
Phys 1830: Lecture 11 http://www.physics.umanitoba.ca/~english/2015winterphys1830/bwimaging/ Download these now. • Tests back later today. • Grades posted only outside my door when they are back. • Review of poorly done questions in next class. • Take up YOUR test during office hours. Today 3pm. • Previous Class: • radio telescopes, interferometry • continuum emission, 21 cm spin flip transition • This class: • How optical images are made. • Workshop on B&W radio images on next test • Upcoming class: • Doppler Shift • Velocity fields • angular momentem • tides and gravity • Astronomy Club • Check Facebook page • (listed on class website)
OPUS! Help with math. Organization of Physics Undergraduate Students. Tutoring Schedule: http://www.physics.umanitoba.ca/undergraduate/OPUS/tutoring.htm Where the tunnel from Armes meets the tunnel going to University Centre. Face the bank machine, look left Allen Building. Go down right hand corridor to find their tutoring office.
The Electromagnetic Spectrum Constructing Colour Images: summary Recall column High Energy Low Energy
Constructing Colour Images: • Data in astronomy are acquired as black and white FITS format files. • For example, a CCD is most sensitive when all of its capacity is devoted to counting numbers of photons. • Therefore we produce greyscale data and images.
For radio telescope data we produce greyscale (black & white) images because: • the colour is too faint to encode • to use all the electronics to capture photons • there is no colour at radio wavelengths
Constructing Colour Images: • Light passes through a filter in front of the satellite's instrument (CCD). This produces black and white images for parts of the spectrum of electromagnetic radiation (and EM radiation includes light).
Charge-Coupled Device for Optical Images • The number of photons per pixel are converted into electrons • the electrons are are read out and converted into numbers inserted into data files. • each pixel can hold about 65500 electrons FITS format files. • however image files (ppm, jpeg, tiff) only have 256 levels of grey.
Review: Charge-Coupled Device for Optical Images • The number of photons per pixel are converted into electrons – very significant device. • Records more light in a given exposure time than film does. • Developers Willard Boyle and George Smith won a Nobel prize in 2009! • Boyle lived in Halifax. • One can count Photons – called “Photometry” • which gives: • Inverse Square Brightness Law • Surface Brightness • and can lead to Image-making
Charge-Coupled Device for Optical Images • FITS format files • 1:65536 • high dynamic range • image files (ppm, jpeg, tiff) • 1:256 • low dynamic range • eye looking at monitor • 1:50 grey levels (tones)
Colour Image-making: Stage 1 • Mapping 65536 “values” to 256 tones (grey levels) is historically called “stretching” • Can be done using powers of ten for example – a logarithmic stretch. • Other functions used are linear (1-to-1), square root and arbitrary functions.
Colour Image-making: Stage 1 Veil Nebula EXAMPLE IN THE OPTICAL • Stretch HST images in preparation for colourizing and combining them. • Note change in detail in stretch on right. • Tip: do not use pure black and white. Black loses faint structures and white saturates when images are combined together.
Colour Image-making: Stage 1 W4 Chimney • Data central wavelengths are • 25 microns – Far IR • 60 microns – Far IR • 21 microns – Radio continuum • 74 microns – Radio continuum • Take notes! This will be on the next test. • There are 4 wavelength ranges. • I’ve mapped them from the FITS file to a selected range of counts. Now try and do your best stretch for each filter to bring out detail.
Review of “Stretching” Write down notes about what you did to stretch an image. (Take a few minutes.) Discuss the following points with your team. Take notes about the discussion and answers (they won’t be on the ppt): • What is a logarithmic histogram? • What GIMP tools did you use to adjust intensities in the black and white images? • How do these tools differ from each other?
Review Question: • You are making images for the public and want to show that at least 3 chemical elements exist in an object. Images are observed through 3 different filters. Each filter should be stretched between the same data values and generate the same grey scale levels. • True • False
Review Question: All the stretches shown at the end of class looked the same. That is, the grey in a specific filament was the same for every team. That filament’s intensity level can only be displayed in an absolute way. • True • False
Colour Image-making: Stage 1 To make B&W stretched images for the colourizing workshop: • http://www.physics.umanitoba.ca/~english/2015winterphys1830/bwimaging/ • Download everything in the section: Needed for the Black and White Workshop Component • Try to repeat what we did in class on your own.
Upcoming Topics • Doppler Shift • Velocity fields