Download

1 / 45
450 likes | 602 Views
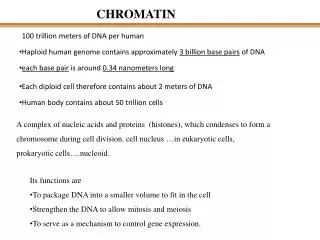
Computational analyses of yeast and human chromatin. William Stafford Noble Department of Genome Sciences Department of Computer Science and Engineering University of Washington. Outline. Sequence-based models of nucleosome positioning Footprinting protein binding sites genomewide.

E N D
Computational analyses of yeast and human chromatin William Stafford Noble Department of Genome Sciences Department of Computer Science and Engineering University of Washington
Outline • Sequence-based models of nucleosome positioning • Footprinting protein binding sites genomewide
Organization of cis-regulatory sequences Chromatin Fiber Gene ‘domains’ Nucleus Trans-factor complex DNaseI Hypersensitive Site Genes Genomic DNA Packaged into Chromatin
4/43 9.3% 33/49 67.3% 108/146 73.9%
Overall approach Microarray data from (Yuan et al. 2006).
Compute frequencies of substrings of length k (k-mers) for k = 1 up to 6. Treat reverse complements as the same k-mer. The resulting vector contains 2772 entries. Sequence spectrum A/T 0.5966 C/G 0.4249 AA/TT 0.1931 AC/GT 0.1116 AG/CT 0.1288 AT/AT 0.0815 CA/TG 0.1674 CC/GG 0.0901 CG/CG 0.0172 GA/TC 0.1330 GC/GC 0.0429 TA/TA 0.0515 AAA/TTT 0.0730 AAC/GTT 0.0343 AAG/CTT 0.0472 AAT/ATT 0.0386 ... TTTAAA/TTTAAA 0.0043
10bp periodicity AA/TT/AT periodicity, Segal 2006 AA periodicity, Drew & Travers 1986 Periodicity in SVM score, Peckham 2007
Segal 2006: The model is positional. The model is generative. Compare predicted positions with 199 sites from the literature. 54% are within 35 bp Expect 39% by chance. The model explains >50% of the signal. The model performs 15% better than chance. Peckham 2007: The model is compositional. The model is discriminative. Compare predicted positions with sites derived from (Yuan 2006). 50% are within 40 bp Expect 33% by chance. The model explains ~50% of the signal. The model performs 17% better than chance. Comparison of yeast models
Dennis et al., Genome Research, 2007 25 kb regions upstream of 42 genes 50-mer probes every 20 bp 3 arrays, 3 copies of each probe, forward and reverse strand → 18 measurements per probe Ozsolak et al., Nature Biotechnology, 2007. 1.5 kb regions upstream of 3692 genes 50-mer probes every 10 bp 7 cell lines Two data sets
Complementary aspects of chromatin accessibility MEC SVM accurately identifies high MNase accessibility. • Strong MNase digestion (MEC) allows the recognition of nucleosome disfavoring sequences. • Weak MNase digestion (A375) allows the recognition of nucleosome forming sequences. Dennis and A375 SVMs accurately identify low MNase accessibility.
Yeast and human concordance 0.862 0.849 Each model was applied to the human ENCODE regions.
Low- and high-scoring regions A375 SVM scores are averaged over 1000 top- and bottom-scoring regions. Flanking lines indicate standard error of the mean.
Dinucleotide frequencies • MNase cleavage bias is unlikely to account for such large differences. • Nucleosome forming sequences exhibit a 3bp periodicity of CG and GC dinucleotides. • Nucleosome disfavoring sequences tends to be low complexity.
Transcription start sites A375 – weak digestion Recognizes nucleosome forming sequences MEC – strong digestion Recognizes nucleosome disfavoring sequences SVM scores are averaged over all TSSs in the ENCODE regions.
Summary • An SVM can discriminate between MNase protected and MNase accessible sequences with high accuracy. • The model learns to recognize complementary phenomena, depending upon the degree of MNase digestion. • The model recapitulates known features of human chromatin. • Most nucleosome positioning is boundary-event driven.
Problem definition • Given • Cut-counts at each position • Unique mappability (Boolean) of each position • Size range of footprints • Size of the background window • Return • A ranked list of non-overlapping footprints, each associated with a statistical confidence score
Foreground window Background window Scoring a candidate footprint A depletion score
Depletion score: binomial distribution • The probability that a window of size a within the target region will contain x or fewer cuts • a: effective foreground window size • b: effective background window size • B: # of cuts in the background window • Score all overlapping windows of width kmin to kmax.
Greedy selection • Generate a non-overlapping set of high-scoring windows • Sort all of the depletion scores in ascending order • Traverse the sorted list, accepting a scored window if it does not overlap a previously accepted window
Empirical null model • Shuffle the cut-counts at the level of genomic positions, together with the mappability information of each position • Repeat the depletion scoring and greedy selection procedure on the shuffled data • Generate a ranked list of footprints • Estimate false discovery rate using Storey method.
Evaluation: gold standard • MacIsaac set [MacIsaac et al. 2006] • Conserved regulatory sites in yeast • Identified from ChIP data • 4387 sites with stringent thresholds • Imperfect • Conservatively defined • Different experimental conditions • Only used to compare different footprint detectors
Evaluation: metric • Recall = TP / (TP+FN) • Precision = TP / (TP+FP)
Results “What fraction of the footprints contain a MacIsaac motif?” “What fraction of the MacIsaac motifs are in footprints?”
Results • Binomial scoring performs better than the simple ratio. • The rank transformation yields better results. • Larger background widths are better. • Using the double scoring scheme does not always help.
238,133 candidate footprints 4514 are significant at q<0.05. Estimated 10,716 footprints in total. Our algorithm identifies 40.0% of these at q<0.05. Results
Scan footprints with MacIsaac motifs, using q<0.05. • 36.6% of the footprints contain a motif. • Also scan intergenic regions. • Every motif occurs more frequently in footprints than in intergenic regions.
Footprints contain known motifs Motif information content is inversely correlated with Phastcons score (p < 0.0022). We identify 5800 footprints at q=0.05. Find 100 motifs with MEME. Identify 20 of these motifs with Tomtom.
Motif discovery 15 sites, E=7e-12 41 sites, E=1e-29 28 sites, E=3e-6 8 sites, E=6e-11 7/8 sites occur in sigma LTRs associated with retrotransposons
MCM1 • The first motif matches the core of the TRANSFAC MCM1 motif.
Motif discovery • 108 occurrences in footprints. • Of these, 42 are within 250bp 5’ of the start of a gene. 41 sites, E=1e-29 28 sites, E=3e-6 • 35 occurrences in footprints. • Of these, 22 are within 250bp 5’ of the start of a gene.
Summary • Digital genomic footprinting provides a nucleotide-level map of DNaseI accessibility across the yeast genome. • This map enables identification of individual protein binding sites. • Dramatically improves the signal-to-noise ratio for motif searching. • The method can be performed on any organism whose genome is sequenced, exposing its entire cis-regulatory framework in a single experiment.