Download
1 / 43
450 likes | 1.03k Views
Using Directed Acyclic Graphs (DAGs) to assess confounding. Glenys Webster & Anne Harris May 14, 2007 St Paul’s Hospital Statistical “Rounds”. The Issue. Confounding introduces bias into effect estimates Common methods to assess confounding can Fail to identify confounders residual bias

E N D
Using Directed Acyclic Graphs (DAGs) to assess confounding Glenys Webster & Anne Harris May 14, 2007 St Paul’s Hospital Statistical “Rounds”
The Issue • Confounding introduces bias into effect estimates • Common methods to assess confounding can • Fail to identify confounders residual bias • Introduce bias by adjusting for non-confounders • Graphical causal models (e.g. DAGs) can help Hernan, MA 2002. Am J of Epidemiol 155 (2): 176-184
Objective • Introduce a graphical method to help assess potential confounders • Directed Acyclic Graphs (DAGs) • Useful during • Study design (which variables to measure?) • Data analysis (which variables to adjust for?)
Overview • Review common methods to assess confounding • Introduce Directed Acyclic Graphs (DAGs) • Exercise: Spot the confounders! • Example: Folate vs neural tube defects • Why incorporating a priori knowledge (using DAGs) matters • Conclusions & Discussion
C E D What is confounding? • Occurs when the relationship observed between E & D is at least partly due to another variable (C) • Occurs when E & D share a common cause E.g. E = yellow fingers, D = lung cancer, C = smoking
How to assess confounding? 3 commonly used methods: • Automatic variable selection (p values) • Compare adjusted vs unadjusted ORs • Check criteria for confounding Confounders are: • Associated with E • Associated with D (in unexposed) • Not in the causal pathway between E & D
BUT! • These methods may lead to bias1-4 by: • Omitting important confounders • Adjusting for non-confounders • Limited consideration of causal mechanisms • Graphical models (e.g. DAGs) can help Weinberg CR 1993. Am J Epidemiol 137: 1-8 Greenland S et al. 1999. Epidemiology 10: 37-48 Robins JM. 2001. Epidemiology 12: 313-320 Pearl J. 2000. Causality. Cambridge University Press
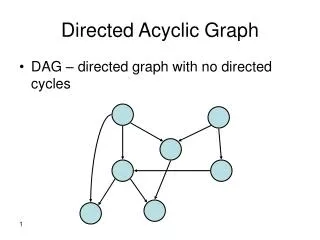
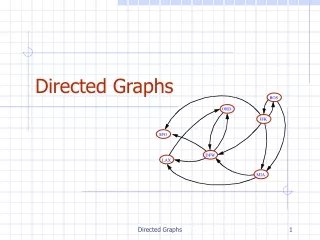
Directed Acyclic Graphs (DAGs) • Picture showing relationships among variables • Incorporate a priori knowledge • Clearly state assumptions • Helps to identify: • Which variables to measure • Confounders & Non-confounders • Proper control for confounding reduces bias
C E D Directed Acyclic Graphs (DAGs) • Nodes (variables) and arrows • Arrows indicate “causaldirection” • Arrows say nothing about the magnitude, shape or the mathematical direction of the association (i.e. positive, negative)
C E D C E D Directed Acyclic Graphs (DAGs) • Directed: Arrows show “causal direction” of association • Acyclic: No feedback loops between E & D (following direction of arrows)
U C E D Variable definitions • E = Exposure • D = Disease • C = Potential confounder • U = Unmeasured variable
C E E D D C DAGs terminology • Ancestor, Parent • Descendent, Child • Common ancestor = Common cause = Confounder • Common descendent = Common effect = Collider
Using DAGs to assess confounding • Draw a DAG • Remove arrow between E D • Are there any open “backdoor pathways” to get from E to D? • If yes confounding need to adjust • If no no confounding do not adjust! • Rules: • Can follow arrows in any direction • Colliders (common effects) BLOCK a path • Adjusting for a non-collider BLOCKs the path • Adjusting for a collider OPENs the path
Example 1: C = common cause C E D Step 1: Remove arrow between E D
Example 1: C = common cause C E D Step 2: Look for backdoor pathways between E & D
Example 1: C = common cause C E D Backdoor path exists! need to adjust for C
Example 1: C = common cause C E D Adjusting for C blocks the backdoor pathway from E to D. There is no more confounding.Observed E D relationship is free of bias
Example 2: C = common effect (collider) E D C Step 1: Remove arrow between E D
Example 2: C = common effect (collider) E D C Step 2: Look for backdoor pathways between E & D
Example 2: C = common effect (collider) E D C • C is a collider Blocks the path • No backdoor pathway do not adjust for C • Adjusting for C would open the pathway, & INTRODUCE BIAS!
Spot the confounders (see handout) • For each graph, should we adjust for C? • Remove arrow between E D • Are there any open “backdoor pathways” to get from E to D? • If yes confounding need to adjust • If no no confounding Do not adjust! • Rules: • Can follow arrows in any direction • Colliders BLOCK a path • Adjusting for a non-colliderBLOCKs the path • Adjusting for a colliderOPENs the path
Fig 5 C E D
Fig 6 U C E D
Fig 7 U C E D
Fig 8 U E D C
Fig 1 E D C
Fig 2 U1 E D C
Fig 3 E D C U2
Fig 4 U1 E D C U2
What do these graphs have in common? What do these graphs have in common? Exercise results
Incorporating a priori knowledge • DAGs incorporate our a priori knowledge about how variables are related • Ignoring this knowledge (e.g. using standard methods to assess confounding) may introduce bias Example from the birth defects literature
Example • Case-control study of folate supplementation (E) and neural tube defects (D). What should be done with mystery variable, C? Crude OR: 0.65 (CI: 0.45-0.94)
Is Mystery Variable ‘C’ a confounder? Method 1: Automatic selection • Build model with D, E and C • If p value of ßC is < 0.1, keep C in model • p value of ßC= 0.001 Conclusion: Adjust for C
Is Mystery Variable ‘C’ a confounder? Method 2: Change in effect size • Compare adjusted and unadjusted ORs • If the difference is > 10%, adjust for C • Unadjusted OR = 0.65 • Adjusted OR = 0.80 • (0.8 - 0.65)/0.65 = 0.23 (23% difference) Conclusion: Adjust for C
Is Mystery Variable ‘C’ a confounder? Method 3: Check rules for confounding • Is C is associated with Folate supplementation (E)? • OR = 0.50 • Is C is associated with Neural tube defects in people who did not take folate (D)? • OR = 15.22 • Is C in the causal pathway between folate and neural tube defects? • No (based on a priori knowledge) Conclusion: Adjust for C
Adjusting for C • All 3 standard methods Adjust for C C = 1 C = 0 ORC=1: 1.09 ORC=0: 0.72 Adjusted OR = 0.80 (95% CI: 0.53, 1.20)
Adjusting for C • Compare adjusted OR to crude OR: ORadjusted= 0.80 (CI: 0.53, 1.20) ORcrude = 0.65 (CI: 0.45-0.94) • Was adjustment appropriate? D C E
E D C C E D What is C? • Stillbirth or therapeutic abortion (C=1) • Live birth (C=0)
Folate Example Key Points • Standard methods to assess confounding include little a priori knowledge about how variables are related • Standard methods may suggest confounding when it is NOT present • Adjusting for non-confounders (colliders) can introduce bias • A causal model (e.g. a DAG) is required to separate colliders from confounders.
Conclusions • Common methods to assess confounding can lead to bias by: • Omitting important confounders • Adjusting for non-confounders • DAGs are used to • Identify confounders and non-confounders (colliders) • Incorporate a priori knowledge • Clearly state your mental model of how system works • Allow others to follow your reasoning • DAGs are useful for study design & data analysis