Download
1 / 41
410 likes | 535 Views
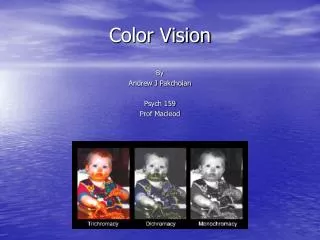
Vision and color. Reading. Glassner, Principles of Digital Image Synthesis , pp. 5-32. Watt , Chapter 15. Brian Wandell. Foundations of Vision. Sinauer Associates, Sunderland, MA, pp. 45-50 and 69-97, 1995. Optics. The human eye employs a lens to focus light.

E N D
Reading • Glassner, Principles of Digital Image Synthesis, pp. 5-32. • Watt , Chapter 15. • Brian Wandell. Foundations of Vision. Sinauer Associates, Sunderland, MA, pp. 45-50 and 69-97, 1995. University of Texas at Austin CS384G - Computer Graphics Fall 2008 Don Fussell 2
Optics • The human eye employs a lens to focus light. • To quantify lens properties, we’ll need some terms from optics (the study of sight and the behavior of light): • Focal point - the point where parallel rays converge when passing through a lens. • Focal length - the distance from the lens to the focal point. • Diopter - the reciprocal of the focal length, measured in meters. • Example: A lens with a “power” of 10D has a focal length of 0.1m. University of Texas at Austin CS384G - Computer Graphics Fall 2008 Don Fussell 3
Optics, cont’d By tracing rays through a lens, we can generally tell where an object point will be focused to an image point: This construction leads to the Gaussian lens formula: Q: Given these three parameters, how does the human eye keep the world in focus? University of Texas at Austin CS384G - Computer Graphics Fall 2008 Don Fussell 4
Structure of the eye • The most important structural elements of the eye are: • Cornea - a clear coating over the front of the eye: • Protects eye against physical damage. • Provides initial focusing (40D). • Iris - Colored annulus with radial muscles. • Pupil - The hole whose size is controlled by the iris. Physiology of the human eye (Glassner, 1.1) University of Texas at Austin CS384G - Computer Graphics Fall 2008 Don Fussell 5
Structure of the eye, cont. • Crystalline lens - controls the focal distance: • Power ranges from 10 to 30D in a child. • Power and range reduces with age. • Ciliary body - The muscles that compress the sides of the lens, controlling its power. Q: As an object moves closer, do the ciliary muscles contract or relax to keep the object in focus? Physiology of the human eye (Glassner, 1.1) University of Texas at Austin CS384G - Computer Graphics Fall 2008 Don Fussell 6
Retina • Retina - a layer of photosensitive cells covering 200° on the back of the eye. • Cones - responsible for color perception. • Rods - Limited to intensity (but 10x more sensitive). • Fovea - Small region (1 or 2°) at the center of the visual axis containing the highest density of cones (and no rods). Density of photoreceptors on the retina (Glassner, 1.4) University of Texas at Austin CS384G - Computer Graphics Fall 2008 Don Fussell 7
The human retina • Photomicrographs at increasing distances from the fovea. The large cells are cones; the small ones are rods. Photomicrographs at incresasing distances from the fovea. The large cells are cones; the small ones are rods. (Glassner , 1.5 and Wandell, 3.4). University of Texas at Austin CS384G - Computer Graphics Fall 2008 Don Fussell 8
The human retina, cont’d Light gathering by rods and cones (Wandell, 3.2) Photomicrograph of a cross-section of the retina near the fovea (Wandell, 5.1). University of Texas at Austin CS384G - Computer Graphics Fall 2008 Don Fussell 9
Neuronal connections • Even though the retina is very densely covered with photoreceptors, we have much more acuity in the fovea than in the periphery. • In the periphery, the outputs of the photoreceptors are averaged together before being sent to the brain, decreasing the spatial resolution. As many as 1000 rods may converge to a single neuron. University of Texas at Austin CS384G - Computer Graphics Fall 2008 Don Fussell 10
Demonstrations of visual acuity With one eye shut, at the right distance, all of these letters should appear equally legible (Glassner, 1.7). Blind spot demonstration (Glassner, 1.8) University of Texas at Austin CS384G - Computer Graphics Fall 2008 Don Fussell 11
Mach bands • Mach bands were first dicussed by Ernst Mach, an Austrian physicist. • Appear when there are rapid variations in intensity, especially at C0 intensity discontinuities: • And at C1 intensity discontinuities: University of Texas at Austin CS384G - Computer Graphics Fall 2008 Don Fussell 12
Mach bands, cont. • Possible cause: lateral inhibition of nearby cells. • Q: What image processing filter does this remind you of? Lateral inhibition effect (Glassner, 1.25) University of Texas at Austin CS384G - Computer Graphics Fall 2008 Don Fussell 13
Higher Level Reasoning • Many perceptual phenomena occur at a higher level in the brain Checker Shadow Effect (Edward Adelson, 1995) University of Texas at Austin CS384G - Computer Graphics Fall 2008 Don Fussell 14
The radiant energy spectrum • We can think of light as waves, instead of rays. • Wave theory allows a nice arrangement of electromagnetic radiation (EMR) according to wavelength: University of Texas at Austin CS384G - Computer Graphics Fall 2008 Don Fussell 15
Emission spectra • A light source can be characterized by an emission spectrum: Emission spectra for daylight and a tungsten lightbulb (Wandell, 4.4) The spectrum describes the energy at each wavelength. University of Texas at Austin CS384G - Computer Graphics Fall 2008 Don Fussell 16
What is color? • The eyes and brain turn an incoming emission spectrum into a discrete set of values. • The signal sent to our brain is somehow interpreted as color. • Color science asks some basic questions: • When are two colors alike? • How many pigments or primaries does it take to match another color? One more question: why should we care? University of Texas at Austin CS384G - Computer Graphics Fall 2008 Don Fussell 17
Photopigments • Photopigments are the chemicals in the rods and cones that react to light. Can respond to a single photon! • Rods contain rhodopsin, which has peak sensitivity at about 500nm. • Rods are active under low light levels, i.e., they are responsible for scotopic vision. Rod sensitivity (Wandell ,4.6) University of Texas at Austin CS384G - Computer Graphics Fall 2008 Don Fussell 18
Univariance • Principle of univariance: For any single photoreceptor, no information is transmitted describing the wavelength of the photon. Measuring photoreceptor photocurrent (Wandell, 4.15) Photocurrents measured for two light stimuli: 550nm (solid) and 659 nm (gray). The brightnesses of the stimuli are different, but the shape of the response is the same. (Wandell 4.17) University of Texas at Austin CS384G - Computer Graphics Fall 2008 Don Fussell 19
The color matching experiment We can construct an experiment to see how to match a given test light using a set of lights called primaries with power control knobs. The color matching experiment (Wandell, 4.10) The primary spectra are a(l), b(l), c(l), … The power knob settings are A, B, C, … University of Texas at Austin CS384G - Computer Graphics Fall 2008 Don Fussell 20
Rods and “color matching” A rod responds to a spectrum through its spectral sensitivity function, p(l). The response to a test light, t(l), is simply: How many primaries are needed to match the test light? What does this tell us about rod color discrimination? University of Texas at Austin CS384G - Computer Graphics Fall 2008 Don Fussell 21
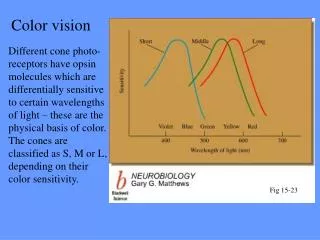
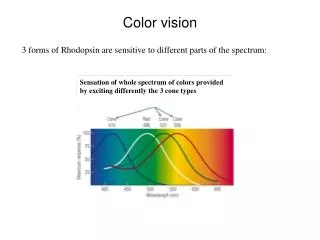
Cone photopigments • Cones come in three varieties: L, M, and S. • Cones are active under high light levels, i.e., they are responsible for photopic vision. l(l) m(l) s(l) Cone photopigment absorption (Glassner, 1.1) University of Texas at Austin CS384G - Computer Graphics Fall 2008 Don Fussell 22
Cones and color matching Color is perceived through the responses of the cones to light. The response of each cone can be written simply as: These are the only three numbers used to determine color. Any pair of stimuli that result in the same three numbers will be indistinguishable. How many primaries do you think we’ll need to match t? University of Texas at Austin CS384G - Computer Graphics Fall 2008 Don Fussell 23
Color matching Let’s assume that we need 3 primaries to perform the color matching experiment. Consider three primaries, a(l), b(l), c(l), with three emissive power knobs, A, B, C. The three knobs create spectra of the form: What is the response of the l-cone? How about the m- and s-cones? University of Texas at Austin CS384G - Computer Graphics Fall 2008 Don Fussell 24
Color matching, cont’d We end up with similar relations for all the cones: We can re-write this as a matrix and equate to the test: and then solve for the knob settings: In other words, we can choose the knob settings to cause the cones to react as we please! Well, one little “gotcha” – we may need to set the knob values to be negative. University of Texas at Austin CS384G - Computer Graphics Fall 2008 Don Fussell 25
Choosing Primaries The primaries could be three color (monochromatic) lasers. But, they can also be non-monochromatic, e.g., monitor phosphors: Emission spectra for RGB monitor phosphors (Wandell B.3) University of Texas at Austin CS384G - Computer Graphics Fall 2008 Don Fussell 26
Color as linear projection We can think of spectral functions in sampled form as n-dimensional vectors, where n is the number of samples. In that case, computing the rod response is a projection from n dimensions to 1 dimension: Likewise, computing cone responses is a projection down to 3 dimensions: University of Texas at Austin CS384G - Computer Graphics Fall 2008 Don Fussell 27
Emission Spectrum is not Color • Clearly, information is lost in this projection step… • Different light sources can evoke exactly the same colors. Such lights are called metamers. A dim tungsten bulb and an RGB monitor set up to emit a metameric spectrum (Wandell 4.11) University of Texas at Austin CS384G - Computer Graphics Fall 2008 Don Fussell 28
Colored Surfaces So far, we’ve discussed the colors of lights. How do surfaces acquire color? Subtractive colour mixing (Wasserman 2.2) A surface’s reflectance, r(l), is its tendency to reflect incoming light across the spectrum. Reflectance is combined “subtractively”with incoming light. Actually, the process is multiplicative: University of Texas at Austin CS384G - Computer Graphics Fall 2008 Don Fussell 29
Subtractive Metamers Surfaces that are metamers under only some lighting conditions (Wasserman 3.9) Reflectance adds a whole new dimension of complexity to color perception. The solid curve appears green indoors and out. The dashed curve looks green outdoors, but brown under incandescent light. University of Texas at Austin CS384G - Computer Graphics Fall 2008 Don Fussell 30
Illustration of Color Appearance “Normalized” How light and reflectance become cone responses (Wandell, 9.2) University of Texas at Austin CS384G - Computer Graphics Fall 2008 Don Fussell 31
Lighting design When deciding the kind of “feel” for an architectural space, the spectra of the light sources is critical. Lighting design centers have displays with similar scenes under various lighting conditions. For example: University of Texas at Austin CS384G - Computer Graphics Fall 2008 Don Fussell 32
What’s wrong with RGB? • RGB cannot represent some colors that we perceive! (using positive weights) • In particular, pure hues other than R, G, or B cannot be represented. • Reason: Adding two pure hues yields a de-saturated color (effectively has some “white” mixed in). • Q: How can we fix this?A: Pick “supersatured” primaries. That’s what CIE color space does. • Note that the supersaturated primaries cannot be perceived! So we’ve traded one problem for another… University of Texas at Austin CS384G - Computer Graphics Fall 2008 Don Fussell 33
Perceivable portion of CIE space University of Texas at Austin CS384G - Computer Graphics Fall 2008 Don Fussell 34
The CIE XYZ System A standard created in 1931 by CIE, defined in terms of three color matching functions. The XYZ color matching functions (Wasserman 3.8) These functions are related to the cone responses roughly as: University of Texas at Austin CS384G - Computer Graphics Fall 2008 Don Fussell 35
CIE Coordinates Given an emission spectrum, we can use the CIE matching functions to obtain the X, Y and Z coordinates. Using the equations from the previous page, we can see that XYZ coordinates are closely related to LMS responses. University of Texas at Austin CS384G - Computer Graphics Fall 2008 Don Fussell 36
The CIE Colour Blob Different views of the CIE color space (Foley II.1) University of Texas at Austin CS384G - Computer Graphics Fall 2008 Don Fussell 37
The CIE Chromaticity Diagram • The CIE Chromaticity Diagram is a projection of the plane X+Y+Z=1. • Dominant wavelengths or hues go around the perimeter of the chromaticity diagram. • A color’s dominant wavelength is where a line from white through that color intersects the perimeter. • Some colors, called non-spectral color’s, don’t have a dominant wavelength. The chromaticity diagram (a kind of slice through CIE space, Wasserman 3.7) University of Texas at Austin CS384G - Computer Graphics Fall 2008 Don Fussell 38
More About Chromaticity • Excitation purity or saturation is measured in terms of a color’s position on the line to its dominant wavelength. • Complementary colors lie on opposite sides of white, and can be mixed to get white. University of Texas at Austin CS384G - Computer Graphics Fall 2008 Don Fussell 39
Gamuts Not every output device can reproduce every color. A device’s range of reproducible colors is called its gamut. Gamuts of a few common output devices in CIE space (Foley, II.2) University of Texas at Austin CS384G - Computer Graphics Fall 2008 Don Fussell 40
Next class: Modern graphics HW • Topic: How do we make the Z buffer algorithm run really fast? • Read: • "The GeForce 6 Series GPU Architecture", Emmett Kilgariff and Randima Fernando, Chapter 30 in GPU Gems 2, edited by Matt Pharr, 2005. University of Texas at Austin CS384G - Computer Graphics Fall 2008 Don Fussell 41