Download

1 / 27
270 likes | 482 Views
5. GDP and the Standard of Living. CHAPTER. EYE ONS. Business Cycle GDP Consumption expenditure GNP Depreciation Real GDP Disposable personal income Real GDP/person Intermediate good or service Nominal GDP Final good or service Standard of living

E N D
5 GDP and the Standard of Living CHAPTER EYE ONS Business Cycle GDP Consumption expenditure GNP Depreciation Real GDP Disposable personal income Real GDP/person Intermediate good or service Nominal GDP Final good or service Standard of living GDP deflator Statistical discrepancy Govt expenditure on goods & services Investment Exports of goods & services Imports of goods & services Net domestic product at factor cost Net exports of goods & services
Is a Computer Program an Intermediate Good or a Final Good? • When American Airlines buys a new reservations software package, is that expenditure an expenditure on a final good or an intermediate good? • Before 1999, the national income accountants counted the purchase of software as expenditure on an intermediate good—and it was excluded from GDP. • Since 1999, the national income accountants have classified the purchase of new software as investment—and is now included in GDP.
Is a Computer Program an Intermediate Good or a Final Good? • How big of a deal is this? • When the Bureau of Economic Analysis (BEA) recalculated the 1996 GDP, the estimate of GDP in 1996 increased by $115 billion—a lot of money. • In 1996, GDP was $7,662 billion, so the increase of $115 billion is 1.5 percent of GDP. • This example shows how the BEA works to measure GDP as accurately as possible.
Making GDP Personal • Where in the National Income and Product Accounts do your transactions appear? How can you use information about GDP in your life? • Your Contribution to GDP • Your own economic transactions show up in the National Income and Product Accounts on both the expenditure side and the income side. • Most of your expenditure is part of Consumption Expenditure. • If you were to buy a new home, that expenditure would appear as part of Investment.
Making GDP Personal • Because you buy goods produced in another country, expenditure on these goods shows up as part of Imports. • If you have a job, your income appears in Compensation of Employees. • Because the GDP measure of the value of production includes only market transactions, some of your own production of goods and services is most likely not counted in GDP. • What are the nonmarket goods and services that you produce? How would you go about valuing them?
Making GDP Personal • Making Sense of the Numbers • To use the GDP numbers in a news report, you must first check whether the reporter is referring to nominal GDP or real GDP. • Using U.S. real GDP per person, check how your income compares with the average income in the United States. • When you see GDP numbers for other countries, compare your income with that of a person in France, or Canada, or China.
DEFINITION VALUE Produced WHAT Produced WHERE Produced WHEN Produced • GDP • The market value • of all the final goods and services • produced within a country • in a given time period. • Does GDP count the value of everything produced? • Does GDP count the market value of a new home? • Does GDP count purchases of Stocks and Bonds?
DEFINITION • Total Expenditure = C+I+G+NX • Also, the total amount received by the producers of final goods and services • C = Consumption • nondurables (food), durables (DVD), services (haircut), rent (apts/houses) • I = Investment • new capital goods (machines), additions to inventory, new home purchases • G = Government • Anything purchased by any level of government • NX= Net Exports • export goods – import goods
DEFINITION • Total Income (Y) = C+S+NT • Expenditure = Income • (b/c firms pay out everything they receive as income to the factors of production • Y = Total Income • wages, interest, rent, profit EARNED FROM labor, capital, land, entr. • C = Consumption • food, housing, vacations, Walmart, etc. • S = Savings • amount of income NOT SPENT on taxes or consumption goods • NT= Net Taxes • taxes paid – cash benefits received from government
Does not include: • Intermediate goods • Used goods GDP - EXPENDITURE APPROACH • Financial Assets (loans not assets) • Values Goods at MARKET PRICE
Income from ALL factors of production: • Wages, interest, rent, profit GDP – INCOME APPROACH • Values Goods at FACTOR COST
Indirect taxes (sales tax) = make MKT price > FTR cost = MUST ADD • Subsidies = make FTR cost > MKT price = MUST SUBTRACT GDP – INCOME APPROACH • Values Goods at FACTOR COST
GDP Exp – GDP Inc = Statistical Discrepancy • Tips are missed in income but caught in expenditure when spent • Most income is reported through IRS but expenditures are typically estimated GDP – INCOME APPROACH • Values Goods at FACTOR COST • Expenditure Approach WINS!
GNP = GDP + Net Factor Income from Abroad GNP DISPOSABLE PERSONAL INCOME
GDP – NOMINAL vs REAL X = WHY? X = X =
Real GDP per person = Real GDP / population • Value of goods & services a person can enjoy • Long-Term trend? • Short-Term fluctuations? • Doubles every 30 yrs • Business cycle REAL GDP PER PERSON WHAT DOES Real GDP PER PERSON MEASURE? • Standard of living ? • Cost of living ?
Edition 5 2001 verse 2008
Edition 5 When Did the Recession Begin?
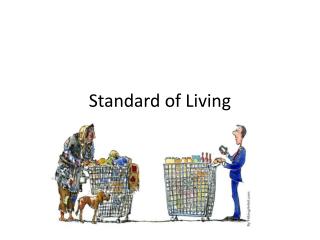
STANDARD OF LIVING <> COST OF LIVING • Omitted from GDP • Household Production • Underground Production • Leisure Time • Environment Quality • Decreasing • #80’s, $90’s • Increases overtime OTHER INFLUENCES on STANDARD OF LIVING • Health and Life Expectancy • Political Freedom and Social Justice • Thus, . . . • HDI – Human Development Index
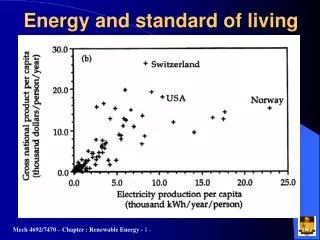
The HumanDevelopment Index The figure shows the relationship between real GDP per person and the Human Development Index (HDI). Each dot represents a country. The small Africa country of Sierra Leone has the lowest HDI and the second lowest real GDP per person.
The Human Development Index The United States has the third highest real GDP per person but has the eighth highest HDI. Why is the United States not ranked higher on the HDI? Because the people who live in seven countries live longer, have better access to health care and education than do Americans.
Expenditure Approach: GDP = C + I + G + NX (Consumption, Investment, Government, Net Exports) FORMULAS Net Exports = Exports - Imports Savings = Y – C - NT Income Approach: GDP = W + I + R + P + Indirect taxes – Subsidies + Depreciation GDP = Net domestic product at factor cost+ Indirect taxes – Subsidies + Depreciation Net Domestic Product at Factor Cost = Wages + Interest + Rent + Profit Total Income: Y = C + S + NT (Consumption + Savings + Net Taxes) Income = Expenditure