Download
1 / 42
440 likes | 648 Views
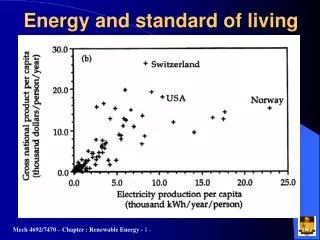
Energy and standard of living. Energy and standard of living. http://planetforlife.com/worldHubbert.htm. http://www.shackell.org.uk/rants/waydown.html. Fossil Fuels. Hits. Discoveries. Production. World Peak Oil (Hubbert). Our ability to catch fish depend on how much is left in the lake.

E N D
http://planetforlife.com/worldHubbert.htm http://www.shackell.org.uk/rants/waydown.html Fossil Fuels
Hits Discoveries Production World Peak Oil (Hubbert) Our ability to catch fish depend on how much is left in the lake • Hits • new wells • peak 1964 • Discoveries • yearly production + known reserves • peak 1987 • Production • peak 2005 Saudi’s no longer have excess capacity Peak Production Total production 2.0 trillion barrels Annual Yield 100 billion barrels to find 1950 2000
NPC Global Oil Report (next 25 years) • Accumulating risks • Need to exploit all energy sources • Need 80 to 120 MBD (presently 86 MBD) • Workforce lacking • 20 trillion dollar issue (IEA) • $3,000 per person • 50% for electrical power generation/distribution • CO2 policies will change energy mix, increase cost and reduce demand Money, Time, Talent and Resources
Energy Drivers • Energy demand growth • Peak fossil fuels • GHG leading to climate change • Environmental emissions • Sustainability • Energy security • Costs
World energy mix 8.4% Renewables • Leading RE • Biomass • Hydro
Solar Nuclear Nuclear Non-FossilEnergy Sources Gravitational Tidal Fission Fusion PV Geothermal Wind Waves Biomass OTEC Hydro Collectors Steam Mech/Turbo Generator Processing Electricity (highest form) Gas & Liquid Fuels Heat (lowest form)
Renewable Sources to Increase RER World demand = 15.0 TW • Solar • 78,000 TW radiation • 39,000 TW water evaporation • 3,600 TW wind & waves • 90 TW Photosynthesis
Renewable Sources to Increase RER World demand = 15.0 TW • Tides • 3 TW Tides caused by moon • Tidal energy using kinetic turbines (power) • Nuclear energy from earth • 32 TW rock conduction • 0.3 TW volcanoes and hot springs
Practical potential of RE • Hydro Power 0.9 TW • can find additional forms • Wind 2 TW • 4% utilization of ≥ class 3 land area) • Geothermal • needs drilling technology breakthrough • Waves and tides 1 - 5 TW • Technology in development
Practical potential of RE • Solar heat all low T heat • marginal economics • Solar PV all power • cost issue & development • Biomass 3 TW • 5% surface area and 0.3% conversion eff. There is no limit of RE except by economics and preferences We need to focus on a portfolio of RE options and let go of favorites
Renewable Energy on Earth Adapted from Rosa
Cost of power • kWhr is energy/work (J), not power (J/s) • kWhr is often written as kW omitting hr • You need to understand the context 1 kWhr = 3.6 MJ
Historical energy use From Sorensen
World energy distribution From Sorensen
Manitoba SE 285 PJ
Green House Gases • Human activity • 35 Billion tonnes • new CO2 per year • 5 tonnes/person • What is effect of human activity • CO2 levels in atmosphere • 1850: 250 ppm • Now: approaching 400 ppm • Danger: 400 to 600 ppm; • Real danger: above 600 ppm www.realclimate.org
Time Green House Gases • Nature: 770 Billion tonnes/yr • Humans: 30 Billion tonnes/yr Add new ball every 2 years
Total Energy Balance Adapted from Sorensen