2 factor ANOVA
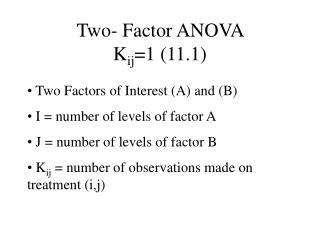
2 factor ANOVA. 2 X 3 Dose by drug (row by column). We would test for. Mean differences between doses (factor A) 2) Mean differences between drugs (factor B) 3) Mean differences produced by the two factors acting together - interactions. All three tests combined into one –


2 factor ANOVA
E N D
Presentation Transcript
We would test for • Mean differences between doses (factor A) 2)Mean differences between drugs (factor B) 3) Mean differences produced by the two factors acting together - interactions
All three tests combined into one – reduces chance of type I error. Get three F ratios -one for each test
Total variability Between treatments variability Within treatments variability Factor A Interaction Factor B
F= variance between the means for Factor A (row means) variance expected from error F= variance between the means for Factor B (column means) variance expected from error F = variance not explained by main effects variance expected from error
What is a main effect? • We collapse across one factor and compare the other factor.
Interactions • There is an interaction if the effect of one factor depends on the level of another factor. • The influence of one variable changes according to the level of another variable. • A X B interaction
Degrees of freedom 2 factor Factor A has a levels and df= a-1 Factor B has b levels and df = b-1 Interaction df = (a-1)(b-1) Error df = N - ab
Example: College DrinkingThere is a line connecting each level of the means for A1, A2, and A3. If we did not consider Gender, then this line would be the main effect of A. In Panel 1, the means differ so there would be a main effect of A. This is not the case in Panel 2.In Panel 3, all the B1s are higher than B2. Thus, there is a main effect of B. Note that A has no effect for B1 or B2. So there is no effect of A or an AB interaction. The latter is because A has no differential effect dependent on B.In Panel 4, A has an effect such that as Year increases drinking increases. Gender (B) has an effect as the B1 line is higher than the B2 line.Big Point Alert - The B1 line is parallel to B2 line. Year effects each Gender in the same fashion. There is No Interaction!In Panel 5, A has an effect such that as drinking increases with age for all groups. B has an effect, as the B1 line is higher than the B2 line.Big Point Alert - The B1 line is Steeper than the B2 line. Thus, the year can have a different effect dependent on your gender. The lines are not parallel. This is an Interaction.In Panel 6 the slopes are opposite. This is a cute one. If you compute the average for B1 vs. B2, forgetting about Year, then there is no effect of gender. If you average the Years forgetting about Gender, the years don't differ. You would get No main effects. There is only an Interaction. That's why we check it first.
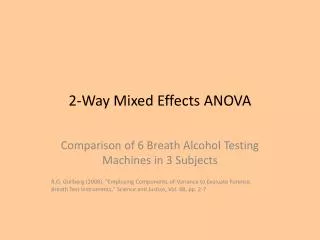
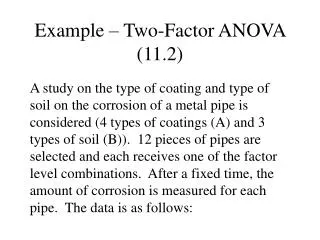
In testing food products for palatability, General Foods employed a 7-point scale from -3 (terrible to +3 (excellent) with 0 representing "average". The experiment reported here involved the effects on palatability of a course versus fine screen and of a low versus high concentration of a liquid component.
Mean food palatability determined by screen size and liquid composition
There was a significant effect of liquid concentration on palatability. F(1,12) = 27.27 p<.05 MS = 10609. The higher concentration of the liquid component was reported to be significantly more palatable than the lower concentration. There was no significant effect of screen size, F(1,12) = 2.632 p>.05 MS = 1024. There was no significant interaction, F(1,12) = 1.08, p>.05, MS = 420.25.
Reporting results of complex design • What kind of test • description of variables and definitions of levels (conditions) of each • summary statistics for cells in design matrix (figure) • report F tests for main effects and interactions • effect size • statement of power for nonsignificant results • description of statistically significant main effect • analytical comparisons post hoc where appropriate – to clarify sources of systematic variation • simple post hoc effects analysis when interaction is statistically significant • description of statistically significant interactions – looking at cell means • conclusion from analysis
Total variability Between treatments variability Within treatments variability Factor A Interaction Factor B
The analysis is based on the following linear model: We will calculate F-ratios for each of these: FA FB FAB
MS A, MS B, MS AB, & MS Within Groups • MS A estimates σ2α • MS B estimates σ2 β • MS AB estimates σ2αβ • MS Within-Groups estimates σ2ε