Download
1 / 41
410 likes | 540 Views
Projections of climate change 2. Outline. Mechanisms for aerosol feedbacks within the climate system a. Biogenic VOCs: ocean, land based b. Sea salt generation c. Dust generation d. Biomass burning Scenario development Projection of emissions, concentrations of GHG’s and aerosols

E N D
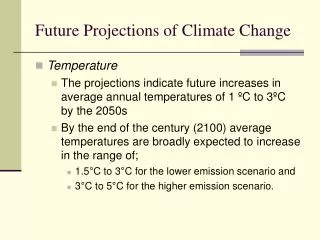
Outline • Mechanisms for aerosol feedbacks within the climate system • a. Biogenic VOCs: ocean, land based • b. Sea salt generation • c. Dust generation • d. Biomass burning • Scenario development • Projection of emissions, concentrations of GHG’s and aerosols • Non-linear response of the climate system: response of temperature, precipitation and effects on aerosols • Interactions between chemistry/climate/aerosols
Aerosol feedbacks from climate change • Biogenic VOCs: ocean (DMS), land based VOCs • Sea salt generation • Dust generation • Biomass burning
Biogenic VOCs: ocean • DMS: • Response of marine ecosystems to climate change, so change in the flux of DMS is uncertain • Flux to atmosphere is a small residual of larger overturning of DMS in ocean mixed layer • DMSP is released from phytoplankton cells by zooplankton grazing, and DMSP is consumption by bacteria releases DMS, but bacteria consume DMS • DMS is correlated with sunlight -- so may be negative feedback(?) to climate
Feedback look proposed by Charlson, Lovelock, Andrea, Warren: Cloud - - DMS flux Low Cloud: Re + Bio_source ? - T
Added complications due to changes in cloud amount: , Cloud_cover - - DMS flux Low Cloud: Re + Cloud amount Bio_source ? - T
Positive feedback loop (Larson, 2005) UV increase , Cloud_cover + - - UV DMS Low Cloud: Re + - Cloud amount Bio_source - - UV
Positive/negative feedback loop (Larson, 2005)/(Vallina and Simó, 2007) UV, TSI increase , Cloud_cover +,+ +,+ -,- UV, vis DMS Low Cloud: Re -,+ +,+ Clouds_other Bio_source -,+ -,- UV, vis
DMS flux change: • Wind speed variations in 2100: + 6.5% (Penner et al., 2100) • Marine biogeochemistry models: • +14% for 3XCO2 (Gabric et al., 2004) • +3% for 2XCO2 (Bopp et al., 2004) • -10% in 2100 (A1B scenario; Kloster et al., 2007)
Biogenic VOCs: land • Annual global biogenic VOC emission estimates range from 500 to 1200 Tg/yr (Guenther et al., 1995) • Depend on T, solar radiation, precipitation • +10% perºC (Guenther et al., 1993) • 500 to 750 Tg/yr isoprene (Guenther et al., 2006) • Greater than a factor of 2 increase in 2100 • Organic aerosol yield depends on compound: 2.5 to 44.5 Tg C/yr aerosol • Yields decrease with increasing T
Biogenic SOA • SOA increases by 26% in 2100 (A1B scenario) Heald et al., 2008
Sea salt generation • Source depends on: • Wind speed • atmospheric stability and wind friction velocity • sea surface and air temperatures • present and prior rain or snow • the amount and nature of surface-active materials in the near-surface ocean waters • Current models: 16,300 Tg/yr ± 200% • 15% in sub-micron size range • Using Gong et al. (1997) production source function (function of wind speed) gave 3340 Tg in 2000 increasing to 5880 Tg in 2100 in A2 scenario (Penner et al., 2001, TAR) 2001 estimate based on Monahan, 1986 algorithm
Dust generation/feedbacks • Source depends on: • Land cover • Precipitation (soil moisture) • Wind speed • 60% decrease to a factor of 3.8 increase as compared to present-day dust emissions (Mahowald and Luo, 2003; Tegen et al., 2004; Woodward et al., 2005; Stier et al., 2006a).
Dust feedbacks • The radiative effect of dust, which, for example, could intensify the African Easterly Waves, may be a feedback mechanism between climate and dust (Jones et al., 2004). • Perlwitz et al. (2001) estimate that alteration of atmospheric circulation reduces the global dust load by roughly 15%, as dust radiative forcing reduces the downward mixing of momentum within the planetary boundary layer, the surface wind speed, and thus dust emission (Miller et al., 2004a) • Ocean biogeochemistry influences on climate • Trace element deposition to Amazon (Okin et al., 2004)
Biomass burning • Increase/decrease of precipitation may lead to decrease/increase of area’s of open biomass burning ?
Climate control of aerosol burdens and cycling • Wind speed changes affect dry deposition • Temperature increases affect on gas/aerosol partitioning • Precipitation changes affect removal • Cloud amount changes affect aqueous production (SO2 + O3 SO4) • Temperature increase affects H2O and OH, H2O2 concentrations
Issues (leading to uncertainty) in scenario development • Nature of the economic development process (do developing countries follow the pathways of industrialized countries?) • Economic growth: is there convergence between countries? (labor force utilization and productivity) • What are GHG emissions given the growth path: • Role of high or low energy-intensive industries • Technological patterns • Geographic distribution of human settlements (impact on transportation and land use) • Consumption patterns for a given income per person • Trade patterns
Kaya identity Emission intensity Affluence
Methodological assumptions for projections • Emission intensity: • Historical experience • Labor productivity • Technological development • Affluence: • Historical • Convergence between countries • Dependence on savings and investment (productivity changes)
2001 IPCC Storylines A1: A world of rapid economic growth and rapid introduction of new and more efficient technologies A2: A very heterogenous world with an emphasis on familiy values and local traditions B1: A world of „dematerialization“ and introduction of clean technologies B2: A world with an emphasis on local solutions to economic and environmental sustainability IS92a „business as usual“ scenario (1992)
Changes in projections since IPCC 2001 BC OC Smith and Wigley, 2006 B2 Streets et al., 2006 B2 Liousse et al., 2005, POLES Liousse et al., 2005 B1 Rau et al., 2005 B1 Streets et al., 2006 B1 + Rau et al., 2005 A2 Streets et al., 2006 A2 +
Projected concentrations CO2 continues to grow even after emissions start to decrease
SO4 concentrations respond immediately to emissions reductions SO4 responds immediately to changes in emissions
Non-linear responses of the climate system: effects on aerosols (Feichter et al., 2004)
Why is AP burden reduced with increases in GHG?% results for ((PD - PI)/PI) Strong decreases in precip. with increases in aerosols! (surface E) -0.87+1.7=0.83
Effect of GHG increases on aerosol concentrations is model-dependant: Kirkevåg et al. 2008 • Aerosol burden increases slightly with increased GHG’s • Temperature change for AP’s and GHG’s is nearly linear • Below cloud scavenging efficiency is smaller than Feichter et al. • The change in stratiform precipitation is small
Interactions between chemistry/climate/aerosols • In addition to aerosol, GHG increases, short-lived components (NOx, CO, VOC O3) may increase • How will increases in these components affect aerosols/climate?
Chemistry/aerosol/climate • Uptake of N2O5, HO2, NO2, NO3 on aerosols • Change in gas/aqueous phase SO2 oxidation • Change in photolysis rates by aerosols • Change in production of SOA
Uptake of gases by aerosols (Lamarque et al. 2005): Neglect of uptake of gases by aerosols Scaling of aerosol emissions NOx, O3 are increased more when uptake is zero: O3 decreases when climate warms (through O1D + H2O) for scaling=0 Practically no effect of uptake on OH
Effect of oxidants and climate on sulfate production: Rae et al. 2007 Mainly precip<0 Predicted changes are nearly linear
SOA formation: Heald et al., 2008 Biogenic sources of SOA can increase as a result of increases in POA emissions: Liao et al. (2006) predict a 31% increase for 2XPOA: Case A Biogenic emissions can increase as a result of T increases: Case B Climate causes changes in aerosol partitioning (decrease); oxidation (increase); removal (via precip.) (increase)
Heald et al. 2008: A: anthropogenic emissions changes; B: biogenic emissions (due to climate); C: climate change;L: land use changes
Summary • Feedbacks between climate change, atmospheric chemistry, and aerosol sources and concentrations are complex and remain an important area for research