Download
1 / 96
960 likes | 1.12k Views
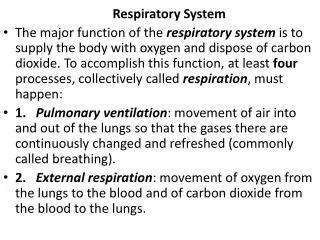
Magic is in the air: Monitoring the respiratory system. C. Putensen Departement of Anesthesiology and Intensive Care Medicine. Estimation of the transvascular volumeflux. • ITBV ↓ ⊥ , EVLW ↑ • ITBV ↑ , EVLW ↑ edema ?. increased permeability ? volume overload/ hydrostatic.

E N D
Magicisintheair: Monitoringtherespiratorysystem C.Putensen DepartementofAnesthesiologyand IntensiveCareMedicine
Estimationofthe transvascularvolumeflux •ITBV↓⊥,EVLW↑ •ITBV↑,EVLW↑ edema? increasedpermeability? volumeoverload/ hydrostatic
FluidrestrictioninARDS 4h Baseline 74±6 12h2/FiO2 PaO 85±6 92±5 PEEP;cmH2O 18±2 18±2 18±2 Pei;cmH2O 28±3 28±3 28±3 CI,l/min/m2 2,8±0,7 3,8±0,7 3,6±0,6 HR;/min 110±7 101±7 122±8 18±3 34±3 19±3 17±4 31±5 18±3 CVP;mmHg 13±3 PAP;mmHg 31±4 PAOP;/min 18±3
FluidrestrictioninARDS R=0.75R2=0.57 28 26 24 22 20 18 16 14 12 10 EVLWI(ml/kg) 200 400 600 800 1000 1200 ITBVI(ml/m2)
Whatisevidencebased? VT Pei RR pH = ≤ ≤ → 6ml/kgpBW 30cmH2O 35/min >7,15 SaO2> 90% PEEP/FiO2titration FiO2 PEEP cmH2O ARDSNetwork.NEJM2004
Themechanicaldistensionofthe lungsCollagenandElastin ≈100 Sress(mbar) 50 40 80 Strain(%) FRC
Stressandstrainofthelungs Stress≈transpulmonalpressure(PTP) Strain≈VT/FRC The linkage is specificregionalcompliance VT FRC Volotrauma PTP=Espec* Barotrauma ChiumelloD,CarlessoE,CadringherP,CaironiP,ValenzaF,PolliF,TallariniF,CozziP,CressoniM,ColomboA,MariniJJ,GattinoniL. Lungstressandstrainduringmechanicalventilationforacuterespiratorydistresssyndrome. AmJRespirCritCareMed.2008;178:346-55.
Stressdistribution-homogenoussystem FT max min MeadJetal.J.Appl.Physiol.28(5):596-608 1970
Spannungsverteilung-inhomogenesSystem max min MeadJetal.J.Appl.Physiol.28(5):596-608 1970
Pulmonal Lunginjury ComplianceLungs(CL)↓↓ ComplianceThoraxicwall(CW)⊥ Extra-pulmonal Lunginjury ComplianceLungs(CL)⊥↓ ComplianceThoraxicwall(CW)↓↓ EW EL EW EL 5 25 15 15 PAW ETOT ETOT 1 Compliance(C) Elastance(E)= Transpulmonalpressure(PTP)=EL/ETOT*PAW
PulmonaryundextrapulmonaryinducedARDS– intraabdominalpressure ChestWallElastance(cmH2O/L) N=21 R=0.83 P<0.0001 3,6 7,2 10,8 14,4 18,0 21,6 25,228,8 IntraabdominalPressure(cmH2O) GattinoniL,PelosiP,SuterPM,PedotoA,VercesiP,LissoniA. Acuterespiratorydistresssyndromecausedbypulmonaryandextrapulmonarydisease.Different syndromes? AmJRespirCritCareMed.1998;158:3-11.
Transpulmonarypressure PTP=PAW-Ppl Paw=30cmH2O LowPpl HighPpl EL/Etot=0.6 EL/Etot=0.4 PTP=18cmH2O PTP=12cmH2O PTP=EL/ETOT*PAW
BouhuysA. Physiologyandmusicalinstruments.Nature1969; 221(187):1199–1204
TidalVolume xETOT PlateauPressure xEL/ETOT Transpulmonal Pressure VILI ?
Barotrauma Biotrauma Atelecttrauma Adjustemenofventilatorsettings accordingV/P-curve mL prior 10,1±0,8 30±2 7±1 180±25 34±4 after 7,5±0,8* 28±1 12±1* 265±19* 38±3 1750 1500 1250 1000 750 VTml/kg PEIcmH2O PEEPcmH2O PaO2/FiO2 PaCO2mmHg Lungvolume VT 500 *p<0.05 250 0 FRC 55cmH2O 0 5 10 15 20 25 30 35 40 45 50 Pa w PEEP PEI PutensenC.,BaumM.,HörmannC. Selectingventilatorsettingsaccordingtovariablesderivedfromthequasi- staticpressure/volumerelationshipinpatientswithacutelunginjury. AnesthAnalg1993;77:436-447.
FRCinassistedmechanicalventilationN2-washout techniqueversusCT N=2 4 +2.SD MW N=2 4 -2.SD R=0.78 ZinserlingJ,WriggeH,VarelmannD,HeringR,PutensenC. Measurementoffunctionalresidualcapacitybynitrogenwashoutduringpartialventilatorysupport. IntensiveCareMed.2003;29:720-6
Lungstress lowvs.highVTandlowvs.highPEEP patientswithhealthy PatientswithALI/ARDS P<0.001 P<0.01 P<0.001 P=0.001 lungs 4 45 03 35 02 25 01 15 05 (cmH2O) transpulmonalpressure Lungstress 0 6ml/kg 12ml/kg 6ml/kg 12ml/kg PEEP5cmH2O PEEP15cmH2O ChiumelloD,CarlessoE,CadringherP,CaironiP,ValenzaF,PolliF,TallariniF,CozziP,CressoniM,ColomboA,MariniJJ,GattinoniL. Lungstressandstrainduringmechanicalventilationforacuterespiratorydistresssyndrome. AmJRespirCritCareMed.2008;178:346-55.
EsophagealPressure Assumption:Pes=meanPpl •Technique: –Ballooncatheterfilledwith0.5mlgas –inthemildethirdoftheesophagus–heartbeatartifacts •LimitationsofPes: –P/Vcharacteristicsundfillingoftheballoon –Inthesupineposition:assumptionisquestionablebecause oftheweightofthelungsandthemediastinum –Nocalibration–occlusiontest? –Artifactscausedbyswallowing,heartinteractions,… –Displacementbyswallowing, InspectionofthePescurveisessential
ΔPes≈ΔPpl Benditt,RespirCare2005;50:68
Postioning 60cm Patientinsupineposition 30degreeupright. 40cm
Inhalation Exhalation Chestwallcompliance InhalationExhalation Inspiratorymuscle effort RespirPhysiol1977;31:63 EurRespirJ1988;1:51 positive pressure ventilation spontaneous breathing mmHg 18 10 mmHg 18 10 BrJAnaesth1976;48:474 CritCareMed1983;11:271 Chest2002;21:533-538
•PEEPlevelsweresettoachievea transpulmonarypressureof0to10cmof wateratendexpiration •Keeptranspulmonarypressure<25cmof wateratendinspiration.
Conclusion-PTP •DeterminationofPTPiscomplexandrequires measurementofPES •DespiteofPTPvariesregionallyweonlydeterminan averagePES •PTPvarieswithequalPPLATcausedbychangesinthe thoraxicwallcomplianceandduringspontaneous breathing •PTPisthemajorforcecontributingtoVILI •VentilatorysettingtargetingPTPmaybefavorable •Easiermonitoringwouldberequired
Protectivemechanicalventilation deltavol(ml) 120 60 EI EE 40 hyperinflated poorlyaerated normallyaerated notaerated 0 -1000 -20 -900 -500 -100 HounsfieldUnits TerragniPP,RosbochG,TealdiA,CornoE,MenaldoE,DaviniO,GandiniG,HerrmannP,MasciaL, QuintelM,SlutskyAS,GattinoniL,RanieriVM. TidalHyperinflationduringLowTidalVolumeVentilationinAcuteRespiratoryDistressSyndrome. AmJRespirCritCareMed2007;175:160-6
Nonprotective–protectivemechanicalventilation Deltavol(ml) EI 120 80 40 EE 0 -1000-900 -20 -500 -100 HounsfieldUnits hyperinflated poorlyaerated normallyaerated notaerated TerragniPP,RosbochG,TealdiA,CornoE,MenaldoE,DaviniO,GandiniG,HerrmannP,MasciaL, QuintelM,SlutskyAS,GattinoniL,RanieriVM. TidalHyperinflationduringLowTidalVolumeVentilationinAcuteRespiratoryDistressSyndrome. AmJRespirCritCareMed2007;175:160-6
Disadvantageofcurrentmeasurements oflungmechanics •globalmeasurements •nomeasurementsofabsoluteFRC/EELV •doesnotgiveanyinformationonspecific lungregions •recruitmentandoverdistensionmayoccur simultaneously
Regionalventilation imagingtechnology
RegionalGascontent ComputertomographyandElectroimpedanceTomography Ventilation + - CT Notatthebedside radiation Intermittentlyapplicable EIT atthebedside noninvasive continouslyapplicable
Electricalconductivperformanceof thechest J.MalmivuoandR.Plonsey,„Bioelectromagnetism“,OxfordPress,1995(modified)
ElectricalImpedanceTomoraphy -EIT- EIT-device
ElectricalImpedanceTomoraphy -EIT- I U U 1 4 1 6 U 2 1 1 5 3 4 U U 1 3 5 U U 1 2 U 6 U 1 1 7 1 0 8 9 U U U U
ElectricalImpedanceTomoraphy -EIT- U I U U 1 4 1 6 2 1 1 5 3 4 U U 1 3 1 2 U 5 6 U 16x13= 208measurements per„Frame“ ➔at50Hz ➔10400 measurements/s U U 1 1 7 1 0 8 9 U U U U
MultipleplaneEITmeasurements MoererO,HahnG,QuintelM. Lungimpedancemeasurementstomonitoralveolarventilation. CurrOpinCritCare2011;17:260-7
InfluenceofPEEPonregional distributionofventilation Bikkeretal.CriticalCare2011,15:R193
Contributionofimpedancewithincreasing distancefromthecross-section definedbythepositionoftheelectrodebelt.
RegionaldistributionofPEEP-inducedoverinflationin32 PatientswithAcuteLungInjury(6«focal»and26«diffuse») Overinflatedlungvolume(%oftotalpulmonaryvolume) 15 10 5 0 5 10 15 25 30cm Apex Diaphragmaticcupola Nieszkowskaetal.,CriticalCareMedicine,32:1496,2004
Imagedisplay new ΔZ positive •Displayofdifferencesofimpedance withrespecttoend-expiratory referencelevel •Colourcodeddisplay ΔZ=0: referencelevel