Download
1 / 15
150 likes | 272 Views
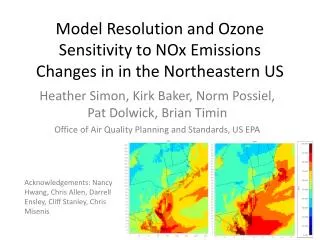
Assessing the impact of the 2008 economic recession on NOx emissions in US megacities. Daniel Tong 1,2,3* , Lok Lamsal 4,5 , Li Pan 1,2 , Charles Ding 1,6 , Hyuncheol Kim 1,2 , Pius Lee 1 , Tianfeng Chai 1,2 , Kenneth E. Pickering 5 , and Ivanka Stajner 7

E N D
Assessing the impact of the 2008 economic recession on NOx emissions in US megacities Daniel Tong1,2,3*, Lok Lamsal4,5, Li Pan1,2, Charles Ding1,6, Hyuncheol Kim1,2, Pius Lee1, Tianfeng Chai1,2, Kenneth E. Pickering5, and Ivanka Stajner7 1) NOAA ARL; 2) UMD CICS; 3) GMU CSISS; 4) USRA; 5) NASA GSFC; 6) UC-Berkeley; 7, NOAA NWS Air Resources Laboratory
Starting – Ending time: December 2007 – October 2009; • Cause: Bursting of the housing bubble in 2007, followed by a subprime mortgage crisis in 2008; • Impacts: • Unemployment rate: 4.7% in Nov 2007 10.1% in Oct 2009. • Income level: dropped to 1996 level after inflation adjustment; • Poverty rate: 12% 16% (50 millions); • GDP: contract by 5.1%; • Worst economic recession since the Great Depression The Great Recession Question: What does it mean to Air Quality (and Emissions)? Air Resources Laboratory
Emission Indicator – Urban NOx in Summer • Short lifetime proximity to emission sources • Urban NO2 dominated by local sources; • High emission density low noise/signal ratio; Methodology • NOx Data sources • Satellite remote sensing (OMI-Aura NO2). • Ground monitoring (EPA AQS NOx); • Emission data ( NOAA National Air Quality Forecast Capability operational emissions); • Deriving the trend: (Y2–Y1)/Y1×100% • Selection of urban areas Air Resources Laboratory
NOx Regulatory Actions Since 2005 • 2003 – 2008: NOx Budget Trading Program (SIP Call) - Summer time power plant emission reductions in 20 states - Point sources can pay for reductions at other facilities (trading) - 2500 large combustion units affected. • 2005: Clean Air Interstate Rule (CAIR) - NOx reductions of 53% by 2009 (2003 baseline). Affects 28 states - Thrown out by courts in 2008. • State-specific rules beyond Federal CAIR have led to further NOx reductions in some states. • 2011: Cross-State Air Pollution Rule (CSAPR) - Replacement of CAIR - Add five additional mid-West states to reduce NOx during ozone season. • Tier II Tailpipe NOx Emission Standards – 5% reduction in fleet emissions per year over 2002 to 2010. Contributed by Ken Pickering
Ozone Monitoring Instrument (OMI) One of four sensors on the EOS-Aura platform (OMI, MLS, TES, HIRDLS) Launched on 07-15-04 Courtesy of OMAR Torres • Instrument Characteristics • -Nadir solar backscatter spectrometer • -Spectral range 270-500 nm (resolution~0.6 nm ) • Spatial resolution: 13X24 km footprint • Swath width: 2600 km (global daily coverage) • 13:45 (+/- 15 min) Local equator crossing time (ascending node) • Data Quality Control • - VCD quality flag; • - Cloud fraction; • Row Anomaly; • Outliners (5% at each end)
AQS: EPA Ambient NO2 Monitoring • Method: Chemiluminescence • Interferences with PAN, O3 and alkyl nitrates • Uncertainty higher at lower end • Select early morning rush hours (6-9AM): higher values and less photochemistry
Base Emission Inventories • US EPA National Emission Inventory 2005 (NEI2005) for U.S. • Environment Canada 2000 EI for Canada; • Mexico 1999 inventories for six board states; • Emission Updates • Point Sources: Annual updates with Continuous Emission Monitoring (CEM) data and DOE Annual Energy Outlook projections. • 2006 Canadian emissions • 2012 updates: Nonroad and mobile sources using from the Cross-State Air Pollution Rule (CSAPR) dataset. NAQFC Emission Updates in 2012 Air Resources Laboratory
O3 (ppbv) NOx Bias (ppbv) Effect on NAQFC NOx and O3 Forecast (July 2011) O3 Diurnal Variations (Pan, Tong, et al., AE, 2014) Air Resources Laboratory
OMI Observed NOx Change (July) Contributed by Lok Lamsal
Inter-Comparison of OMI, AQS and NAQFC Atlanta Boston NOx Change from 2005 Level (%) Dallas Houston
Inter-Comparison of OMI, AQS and NAQFC(Continued) Los Angeles New York NOx Change from 2005 Level (%) Philadelphia Washington, DC
Morning Rush Hours vs Early Afternoon Boston Atlanta Houston Dallas New York Los Angeles Washington, DC Philadelphia
Seven-year NOx Changes • Both observations (OMI and AQS) revealed -5%/yr reduction rate; • NAQFC adopted change corresponds to -3.5%/yr;
NOx Changes Prior to, during and after the Recession • Distinct regional difference; • Average NOx changes are consistent for OMI and AQS data; • -6%/yr - -7%/yr prior to Recession; • -9%/yr - -11%/yr during Recession; • -3%/yr after Recession (Recovery?).
Summary • Derived long-term urban NOx trends from satellite (OMI) and ground observations (AQS); • Revealed consistent NOx responses to the 2008 Economic Recession by OMI and AQS (-6%, -10%, and -3% reduction per year before, during and after the Recession); • The 2012 NAQFC updates adjusted NOx emission in the right direction, but further emission reduction is needed; • Demonstrated how to use space and ground observations to evaluate emission updates.