Download
1 / 18
210 likes | 420 Views
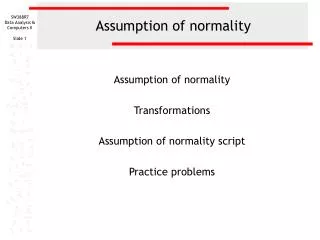
Robustness of the EWMA control chart to non-normality. Connie M Borror; Douglas C Montgomery; George C Runger Journal of Quality Technology; Jul 1999; 31, 3. Introduction. Individual measurements occur frequently in the chemical and process industries.

E N D
Robustness of the EWMA control chart to non-normality Connie M Borror; Douglas C Montgomery; George C Runger Journal of Quality Technology; Jul 1999; 31, 3
Introduction • Individual measurements occur frequently in the chemical and process industries. • The traditional method of dealing with the case of n=1 is to use the Shewhart individuals control chart to monitor the process mean. • The individuals control chart has two widely-cited disadvantages: • (1) the chart is not very sensitive to small shifts in the process mean. • (2) the performance of the chart can be adversely affected if the observations are not normally distribution. • It is certainly true that non-normality of the process data is often not a significant concern if the X-bar control chart is used to monitor the mean.
Introduction • In this paper, we show that the ARL performance of the Shewhart individuals control chart when the process is in control is very sensitive to the assumption of normality. • We suggest the EWMA control chart as an alternative to the individuals chart for non-normal data. • We show that, in the non-normal case, a properly designed EWMA control chart will have an in-control ARL that is reasonably close to the value of 370.4 for the individuals chart for normally distributed date. • For all cases, the ARL’s were computed using the Markov chain method.
Background Information-EWMA • The EWMA is defined as • Where xi is the current observation and λ, smoothing parameter, is a constant for 0≦λ≦1 • The control limits for the EWMA control chart are • Where L determines the width of the control limits
Background Information-EWMA • For large values of i , the steady-state EWMA control limits are • If any point exceeds the control limits, the process is assumed to be out of control.
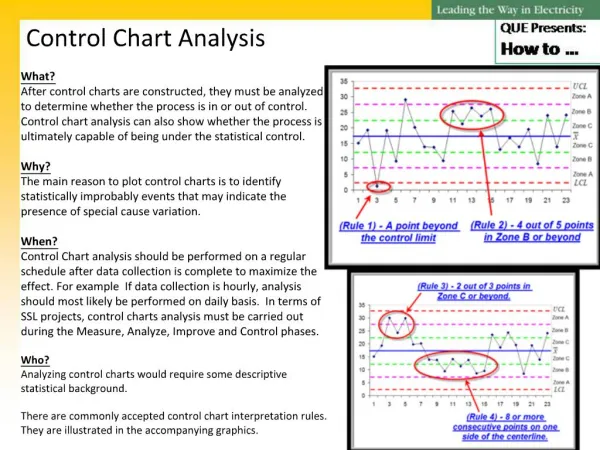
Background Information-Skewed and symmetric distribution • To study the robustness of the EWMA control chart and the individuals control chart to normality assumption, both skewed and symmetric distribution were examined. • Symmetric distribution:t distribution • Let k is degree of freedom • The Mean is 0 • The Variance is k/(k-2)
Various t distribution and normal distribution with the same mean and variance
Background Information-Skewed and symmetric distribution • Skewed distribution:Gamma distribution • Let α=0.5, 1, 2, 3, and 4, while holding β=1
Various Gamma distribution and normal distribution with the same mean and variance
Results • The normal-theory ARL for individuals control chart with 3σ is known to be 370.4. • For the EWMA, we can determine the values of λ and L to obtain approximately the same ARL of 370.4. • Value of 0.05, 0.1, and 0.2 were chosen for λ, with the corresponding value of 2.492, 2.703, and 2.86, respectively, chosen for L.
In-Control ARL’s for EWMA-Gamma The Best Case
Out-of-control ARL’s for the EWMA-t EWMA is better than Shewhart
Comparing three EWMA control chart designs • There have been many suggestion in the literature for designing an EWMA control chart. • The table compares three EWMA control chart designs. • 1st column:λ=0.1 and L=2.7 (Montgomery, 1996) • 2rd column :λ=0.1 and L=3 (computer packages) • 3th column :λ=0.4 and L=3 (Hunter, 1989)
Comparing three EWMA control chart designs In-Control For λ=0.1 and L=3, the ARL’s are too large. For λ=0.4 and L=3, the ARL’s are smaller than the normal-theory value.
Conclusions • 在In control的情況下,λ=0.05 and L=2.492 EWMA 管制圖在非常態ARL值接近常態假設的ARL值。不會超出8%的差距(沒有低於340.76)。 • 在In control的情況下,除了極端非常態的分配參數值(t6、t4、Gam1,1、Gam0.5,1),λ=0.1 and L=2.703 EWMA 管制圖在非常態的ARL與常態的ARL不會超出15%的差距(很少低於315)。 • 在不同的分配參數的情況下,EWMA偵測製程偏移的能力並沒有太大的差別。