Testing Normality
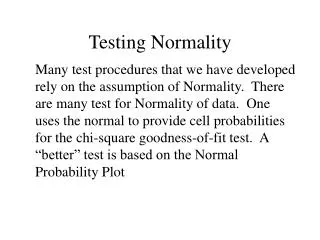
Testing Normality. Many test procedures that we have developed rely on the assumption of Normality. There are many test for Normality of data. One uses the normal to provide cell probabilities for the chi-square goodness-of-fit test. A “better” test is based on the Normal Probability Plot.

Testing Normality
E N D
Presentation Transcript
Testing Normality Many test procedures that we have developed rely on the assumption of Normality. There are many test for Normality of data. One uses the normal to provide cell probabilities for the chi-square goodness-of-fit test. A “better” test is based on the Normal Probability Plot
Testing Normality Cont’d Recall: The NPP should be approx linear for normal data, and the correlation coefficient is a measure of linearity. If r is much less than one, we would conclude that the data doesn’t come from a Normal distribution.
Ryan-Joiner Test • Order the data x(1),…,x(n) • Compute the normal percentiles • Compute the correlation coefficient, r, for the (yi,x(i)) pairs
Ryan-Joiner Test • 4. State the Null and Alternative Hypotheses • Ho: The population is normal • Ha: The population is not normal • 5. Specify alpha and obtain critical values from Table A.14. Compare r to this value
Example Consider the following data. Use the Ryan-Joiner test to test the assumption of normality at =.10
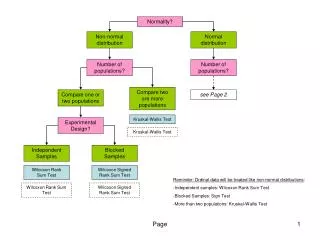
Testing Homogeneity of Populations *We wish to compare I multinomial populations, each with J categories. * Take ni samples from the ith population Let Nij be the number of observations from the ith population in the jth category. Hence, j Nij = ni Place the data in a I x J table
Corresponding to each cell, there is a cell probability pij=probability and outcome for the ith population falls into the jth category, where j pij = 1
Test Ho: p1j = p2j = … = pIj , j = 1,…,J Ha: Some pij pi’j Under Ho, the common cell probability pj is estimated by
Test Cont’d The estimated expected cell frequency is The test statistic is Rejection Region: X2 > 2 with d.f = (I-1)(J-1)
Testing for Association * Individuals are categorized by two categorical variables. We wish to determine whether these variables are associated. * Row Categories – A1,…,AI Column Categories – B1,…,BJ
n = Total number of observations • nij = the number of individuals classified as Ai and Bj • Hence, nij = n • Ho: P(AiBj) = P(Ai)P(Bj) for all i,j • Ha: Some P(AiBj) P(Ai)P(Bj)
Expected Frequency: Test Statistic: Rejection Region: X2 > 2 with d.f = (I-1)(J-1)