Example: Selectivity Estimation after Join
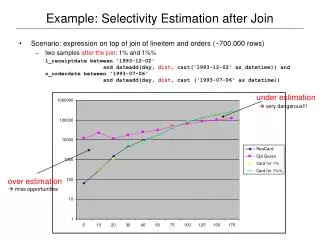
Example: Selectivity Estimation after Join. Scenario: expression on top of join of lineitem and orders (~700.000 rows) two samples after the join : 1% and 1%%

Example: Selectivity Estimation after Join
E N D
Presentation Transcript
Example: Selectivity Estimation after Join • Scenario: expression on top of join of lineitem and orders (~700.000 rows) • two samples after the join: 1% and 1%% l_receiptdate between '1993-12-02' and dateadd(day, dist, cast('1993-12-02' as datetime)) ando_orderdate between '1993-07-06‘ and dateadd(day, dist, cast ('1993-07-06' as datetime)) under estimation very dangerous!!! over estimation miss opportunities
Cardinality Estimation – Sample Views • Know Types of Solutions • improving the single table synopsis(wavelets, multidimensional histograms, etc.) • directly using feedback (-> FBV project) • pros: direct improvement • cons: no materialized evidence of the decision • using feedback history (-> IBM Leo approach) • pros: very accurate, if parts of the predicate are in the FB repository • cons: feedback info may be outdated, significant computational overhead • using Stats on Views (MS / IBM) • pros: simple • cons: no versatile solution • using Sampling during Query Compilation (Oracle) • pros: ‘better than nothing’ • cons: single table expressions, only selectivity, table sampling (fixed no of blocks), based on query hints • Sample View • materialized view storing only a random sample of the corresponding data set(for now: assume join-only view) • GOAL: Support traditional cardinality estimation • estimate cardinality • for any arbitrary expression • at any ‘matchable’ node in the operator tree • by executing a probe query against the matching sample view
Exploitation loop(optimization time) Feedback loop(execution time) View matching ⋈ Report actual cardinalities σ GB Injection ofnew estimate Monitor quality of estimates Control chart for SV2 ⋈ U Probe query generation σ ⋈ S T R Take corrective action: + refresh sample + create additional views + refresh histograms Probe query execution Exploit, monitor, improve… Query Databasestatistics R S T U SV1(R,S) SV2(R,S,T) SV3(U,V) Sample View Sample View Sample View Histograms
Sample view SV2 ⋈ ⋈ T ⋈ (5) Inject new cardinalities S R σ GB (2) Probe query generation ⋈ U Probe query σ ⋈ Compute aggregates GB S T Cardinalityestimator R Pr Evaluatepredicates SV2 (3) Probe query execution (4) Report sample measures Estimation Process when using Sample Views (1) View matching Regular cardinality estimation Databasestatistics R S T U SV1(R,S) SV2(R,S,T) SV3(U,V) Internal Synopses Sample View Sample View Sample View Histograms
with <10% outside of 95%c.i. Sequential Sampling – MSSales – Q17 1,5% MSSales – Q17 (sample view: 5%)
Sequential Sampling – MSSales – Q35 with <10% outside of 95%c.i. 1,5% MSSales – Q35 (sample view: 5%)
Sequential Probe Queries number of hash values only last combination compute k and n for every hash combination (preaggregation) select top(1) sum(cnt_p), sum(cnt), count(__hash) from (select __hash, sum(cnt_p) as cnt_p, count(*) as cnt from (select __hash, case when <pred> then 1 else 0 end as cnt_p from <sampleview> with (noexpand)) x group by __hash) y group by all with stepwise having (1000*(sum(cnt)-sum(cnt_p)) < 2.6*sum(cnt)*sum(cnt_p)) or (100*sum(cnt_p) < sum(cnt) andsum(cnt_p)*(sum(cnt)-sum(cnt_p)) > 6.5077*sum(cnt)) or count(__hash) > 100 or max(__hash) = 54321 option (order group) check relative error of 95%ci < 10% minimal evidence absolute error (p<1%): n<5 return at least the cumulative value for the last hash value stepwise scalar aggregate NO SORT !!!
MSSales – Database (Q17) - orig Number of Rows: 174041 Actual Number of Rows: 91692 Estimated Number of Rows (orig): 343 Number of Rows: 836888 SELECT L.FiscalYearID, L.FiscalQuarterID, TT.TOrgEngagementTypeID, TT.TOrgResellerTypeId, TT.TOrgSubsidiarySubDistrictID, TC.COrgTPName, TT.TOrgSubsidiaryID, L.FiscalMonthID, TT.TOrgTPName, SUM(convert(money,(A.ActualRevenueAmt/AG.ExchangeRate))) FROM TPM1DSTSALSL00 A, SalesDate L, TPM1DSTSALSL00_TOrg TT, TPM1DSTSALSL00_COrg TC, ExchangeRate AG, TPM1DSTSALSL00_License AB, TPM1DSTSALSL00_COrgParent PC WHERE A.SalesDateID = L.SalesDateID AND A.TTxlatOrgID = TT.TTxlatOrgID AND A.CTxlatOrgID = TC.CTxlatOrgID AND A.SalesDateID = AG.SalesDateID AND A.LicenseTransactionItemId = AB.LicenseTransactionItemId AND A.CTxlatOrgID = PC.CTxlatOrgID AND ( AG.CurrencyID = 30 AND A.TRCreditedSubsidiaryID = 40 AND A.ChannelId IN(1,3) AND TT.TOrgEngagementTypeID = 2 AND TT.TOrgResellerTypeId = 194 AND TT.TOrgSubsidiarySubDistrictID IN(7906,7913,7915,7922,7928,7933,7937,7944,7946) AND TC.COrgTPID IN(477172,295555,529802,295585,796864,395604,295600,292494,295552,295583) AND AB.ProgramId IN(10,12,9,11,0,3,14,13,8) AND A.SalesDateID IN(40,41,42,43,44) AND PC.COrgTPSubsidiarySubDistrictID IN(7907,7918,7921,7925,7927,7930,7932,7935,7905,7911,7917,7920,7931,7938,7941,7943,7948,7901,7906,7909,7915,7923,7926,7939,7944,7913,7922,7928,7933,7937,7946,7934,7912,7902,7903,7908,7916,7924,7947,7904,7910,7914,7919,7929,7936,7940,7942,7949,7945)) AND ( A.TRCreditedSubsidiaryID IN ( 36,37,40,41,42,61,63,64,66,67,68,81)) GROUP BY L.FiscalYearID, L.FiscalQuarterID, TT.TOrgEngagementTypeID, TT.TOrgResellerTypeId, TT.TOrgSubsidiarySubDistrictID, TC.COrgTPName, TT.TOrgSubsidiaryID, L.FiscalMonthID, TT.TOrgTPName
MSSales – Database (Q17) – using Sample Views Actual Number of Rows: 91692 Estimated Number of Rows (orig): 343 Estimated Number of Rows (SV): 89771 • sample range: 49321 – 49723 • effective sampling rate: 0,402% • number of rows: 3435
MSSales – Database (Q35) Number of Rows: 188873 Number of Rows: 836888 Actual Number of Rows: 200175 Estimated Number of Rows (orig): 3 Estimated Number of Rows (SV): 204886 sp_createstats @fullscan = 'fullscan' • sample range: 49321 – 49464 • effective sampling rate: 0,143% • number of rows: 1205 SELECT L.FiscalMonthID, F.ProductFamilyID, TC.COrgName, F.ItemName, F.PartNumber, SUM(convert(money,(A.ActualRevenueAmt/AP.ExchangeRate))), SUM(convert(float,A.ActualQuantityCnt)), TT.TOrgName FROM TPM1DSTSALSL00 A, SalesDate L, ProductMaster F, TPM1DSTSALSL00_COrg TC, TPM1DSTSALSL00_CRSubs AP, TPM1DSTSALSL00_TOrg TT, ExchangeRate AG, TPM1DSTSALSL00_License AB WHERE A.SalesDateID = L.SalesDateID AND A.ProductID = F.ProductID AND A.CTxlatOrgID = TC.CTxlatOrgID AND A.TRCreditedSubsidiaryID = AP.CreditedSubsidiaryID AND A.TTxlatOrgID = TT.TTxlatOrgID AND A.SalesDateID = AG.SalesDateID AND A.LicenseTransactionItemId = AB.LicenseTransactionItemId AND AG.CurrencyID = 29 AND A.ChannelId = 1 AND AB.ProgramId = 0 AND A.SalesDateID IN(40,41,42,43,44) AND TC.COrgSubsidiarySubDistrictID IN(2300,2301,2302,2303,2304,2305,2306,2307,2308,2309,2310,2311,2312,2313,2314,2315,2316,2317,2318,10014) AND F.ProductFamilyID IN(187,188,189,962,1132,1555,1592,1830,70,214,219,681,959,1098,1133,1336,1597,1857,824,825,827,995,1039,1603,1899,62,193,661,837,1554,1613,666,858,1296,1621,682,684,861,1353,1622,889,924,963,936,975,1103,986,74,376,577,650,823,872,1337,1633,1851,195,196,263,669,670,671,672,673,675,677,678,716,717,718,719,720,882,998,1000,1002,1004,1026,1119,1262,1263,1264,1265,1266,1294,1386,1553,1635,1829,194,668,1018,1590,1896,63,65,66,67,68,71,72,73,185,186,190,191,192,197,202,203,204,205,207,208,211,215,216,217,218,220,221,222,223,224,258,377,384,387,394,397,415,418,421,452,466,467,470,553,591,614,664,685,692,728,803,921,953,1008,1324,1559,1645,64,935,1669,1171,1174,1172,1175,1176) AND A.TRCreditedSubsidiaryID IN ( 13,14,15,16,17,18,20,22,25,26,27,28,29,30,31,32,34,35,54,55,56,57,58,59,72,73,74,77,80,82,83,103,93,75,21,24,104) GROUP BY L.FiscalMonthID, F.ProductFamilyID, TC.COrgName, F.ItemName, F.PartNumber, TT.TOrgName
⋈ Quality Control actual cardinality • (1) Normalization using Cumulative Binomial Distribution • pnorm := BinCumDist(pest, preal) • (2) Smoothing using Exponential Weighted Moving Average • pEWMA := α * pnorm + (1- α) * pEWMA σ GB ⋈ SV-based cardinality U ⋈ σ ⋈ σ GB S T R ⋈ U alternative estimate if outside of control bound σ ⋈ Refresh Pending Mode S T InfoPack R create background refresh job • - SVId, Version# • - #rows sample • - #rows pred sample • - eff. sampling rate • alternative estimate • actual cardinality - perform refresh (2 TAs) - increment Version# - reset pEWMA delete/insert Quality Control Process for Sample Views Compile Time Run Time Match & Compensation Cardinalityestimator Probe query Sample Views SV1(R,S) SV2(R,S,T) SV3(U,V) #3 #6 #1
Refresh Trace update of base data SV refresh current p out-of-control bound EWMA p Selectivities sample view base data