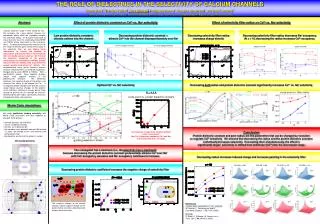
Frequency selectivity 2
Frequency selectivity 2. Masking and the auditory filter. Masking. 60 dB SPL. 80 dB SPL. And he said, “ I know how to study the soul! ”. So on October 22, Fechner sat up in bed…. Definitions. Masking is the reduction in audibility of one sound caused by the presence of another sound.

Frequency selectivity 2
E N D
Presentation Transcript
Frequency selectivity 2 Masking and the auditory filter
Masking 60 dB SPL 80 dB SPL And he said, “I know how to study the soul!” So on October 22, Fechner sat up in bed…
Definitions • Masking is the reduction in audibility of one sound caused by the presence of another sound. • The amount of masking is the difference between the threshold for the target sound with no masker and the threshold for the target sound with the masker.
“swamping” suppression Why does simultaneous masking occur?
Characteristics of simultaneous masking From Gelfand (1998)
When a tone is masked by a broadband noise, masked threshold Increases slightly at higher probe frequencies Decreases dramatically at higher probe frequencies Is exactly the same at all probe frequencies Can be lower than absolute threshold 0 Answer Now
Growth of simultaneous masking 10 dB increase in masker level leads to a 10 dB increase in masked threshold (amount of masking) From Gelfand (1998)
What does a person do when they are trying to detect a tone in noise? Level (dB) 1.0 1.1 1.26 Freq (kHz) Relative amplitude (dB) 794 1000 1260 1588 Frequency (kHz)
Masking and masker bandwidth Level (dB) Level (dB) 25 25 1.0 1.1 1.26 1.0 1.1 1.26 Freq (kHz) Freq (kHz) Relative amplitude (dB) Relative amplitude (dB) 794 1000 1260 1588 794 1000 1260 1588 Frequency (kHz) Frequency (kHz) Level (dB) 25 Level (dB) 25 1.0 1.1 1.26 1.0 1.1 1.26 Freq (kHz) Freq (kHz) Relative amplitude (dB) Relative amplitude (dB) 794 1000 1260 1588 794 1000 1260 1588 Frequency (kHz) Frequency (kHz)
Masking and the critical band From Yost (1994)
Masking and the critical band The filter through which we listen to sounds is called the auditory filter. From Gelfand (1998)
Masking and masker frequency Level (dB) 1.0 1.1 1.26 Freq (kHz) Relative amplitude (dB) 794 1000 1260 1588 Frequency (kHz)
Masking and masker frequency Level (dB) 1.0 1.1 1.26 Freq (kHz) Relative amplitude (dB) 794 1000 1260 1588 Frequency (kHz)
0 Answer Now The frequency of the signal was • 250 Hz • 500 Hz • 1000 Hz • 2000 Hz
0 Answer Now What is changing as the curve moves up to higher amounts of masking? • The level of the signal • The frequency of the signal • The level of the masker • The frequency of the masker
0 Answer Now When the masker frequency equals the signal frequency, increasing the level of the masker by 20 dB increases the amount of masking by • 5 dB • 10 dB • 15 dB • 20 dB
0 Answer Now True or false?If the masker frequency does not equal the signal frequency, increasing the level of the masker by 10 dB increases the amount of masking by 10 dB • True • False
So far • Frequency selectivity gives us a good representation of the amplitude spectrum and helps us to hear what we want to hear in noisy conditions. • Cochlear filtering is reflected in some neurons throughout the auditory pathway. • Masking is the reduction in audibility in one sound caused by the presence of another sound.
So far (continued) • In general, a 10 dB increase in masker level leads to a 10 dB increase in simultaneous masking. • but this only works if the signal frequency is part of the masker • In a broadband masker, only the band of noise around the signal frequency does the masking. • Then-- psychophysical tuning curves
20 ? 20 ? Level (dB SPL) Level (dB SPL) 1000 1200 800 1000 Frequency (Hz) Frequency (Hz) Another masking experiment masker masker probe probe ? Masker level (dB SPL) 1000 Masker frequency (Hz)
Psychophysical tuning curve(the auditory filter) From Yost (1994)
Upward spread of masking: low frequencies mask high more than high mask low From Yost (1994)
Masking and masker frequency Level (dB) 1.0 1.1 1.26 Freq (kHz) Relative amplitude (dB) 794 1000 1260 1588 Frequency (kHz)
Masking and masker frequency Level (dB) 1.0 1.1 1.26 Freq (kHz) Relative amplitude (dB) 794 1000 1260 1588 Frequency (kHz)
1000-Hz tone 500-Hz tone 2000-Hz tone 0 Answer Now Which would mask a 1000 Hz tone at the lowest level?
Which would mask a 1000 Hz tone at the lowest level? 2000-Hz tone 500-Hz tone 4000-Hz tone 0 Answer Now
Is the auditory filter the peripheral filter? From Yost (1994)
Off-frequency listening From Gelfand (1998)
So... • Psychophysical tuning curve and critical bandwidth measures of frequency resolution don’t control for off-frequency listening. • (People will use whatever information is available to them to detect that tone.)
Auditory filter width experiment Notchednoise Filter we’re measuring From Moore (1997)
Narrow v. broad filters Threshold (dB SPL) Notch width (Hz)
Narrow v. broad filters Threshold (dB SPL) Notch width (Hz)
Thresholds at different notch widths BROAD NARROW From Patterson et al. (1982)
The auditory filter Attenuation (dB) Notch width From Moore (1997)
They wouldn’t change They would get broader They would get narrower 0 Answer Now What would happen to the auditory filters of a person who lost his outer hair cells?
Effects of cochlear hearing loss on auditory filters Normal Impaired From Glasberg & Moore (1985)
Auditory filter width v.critical bandwidth From Moore (1997)
Conclusions • The results of masking experiments suggest that the auditory filter is established in the inner ear. • The width of the auditory filter largely determines how well we can hear sounds in noise (which is almost always). • People will use whatever information is available to them, even when the task is as trivial as detecting a tone.
Text sources • Gelfand, S.A. (1998) Hearing: An introduction to psychological and physiological acoustics. New York: Marcel Dekker. • Glasberg, B. & Moore, B.C.J. (1985). Auditory filter shapes in subjects with unilateral and bilateral cochlear impairments. J. Acoust. Soc. Am., 79(4), 1020-1033. • Moore, B.C.J. (1997) An introduction to the psychology of hearing. (4th Edition) San Diego: Academic Press. • Patterson, R.D., Nimmo-Smith, I., Weber, D.L., & Milroy, R.. (1982). The deterioration of hearing with age: Frequency selectivity, the critical ratio, the audiogram, and speech threshold. J. Acoust. Soc. Am., 72, 1788-1803. • Yost, W.A. (1994) Fundamentals of hearing: an introduction. San Diego: Academic Press.