Download
1 / 25
260 likes | 853 Views
Oxygen and Carbon dioxide Transport. Dr. Laila Al- Dokhi. Objectives. Understand the forms of oxygen transport in the blood, the importance of each. Differentiate between O2 capacity, O2 content and O2 saturation. Describe (Oxygen- hemoglobin dissociation curve)

E N D
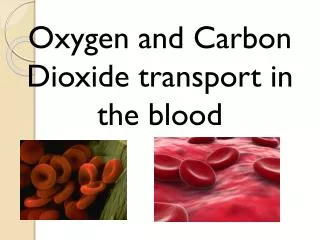
Oxygen and Carbon dioxide Transport Dr. Laila Al-Dokhi
Objectives • Understand the forms of oxygen transport in the blood, the importance of each. • Differentiate between O2 capacity, O2 content and O2 saturation. • Describe (Oxygen- hemoglobin dissociation curve) • Define the P50 and its significance. • How DPG, temperature, H+ ions and PCO2 affect affinity of O2 for Hemoglobin and the physiological importance of these effects. • Describe the three forms of carbon dioxide that are transported in the blood, and the chloride shift.
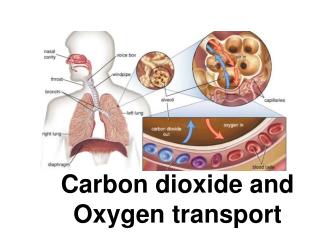
Transport of O2 and CO2 in the blood and body fluids • O2 is mostly transported in the blood bound to hemoglobin • If the PO2 increases Hb binds O2 • If PO2 decreases Hb releases O2 • O2 binds to the heme group on hemoglobin, with 4 oxygens /Hb
3% dissolved in plasma • 97% bound to hemoglobin(oxyhemoglobin) • Higher PO22 results in greater Hb saturation. • The relation between PO2 and Hb-O2 is not linear. The curve is called Oxyhemoglobin Saturation Curve • Which is S- shaped or sigmoid
O2 capacity, content and saturation. O2 content: amount of O2 in blood (ml O2/100 ml blood) O2-binding capacity: maximum amount of O2 bound to hemoglobin (ml O2/100 ml blood) measured at 100% saturation. Percent saturation: % of heme groups bound to O2 % saturation of Hb = oxygen content x 100 oxygen capacity Dissolved O2:Unbound O2 in blood (ml O2/100 ml blood).
Transport of oxygen in arterial blood • When blood is 100% saturated with O2: each gram of Hb carry 1.34 ml O2 So O2 content = 15g Hb x 1.34 O2=20 ml. But when the blood is only 97% saturated with O2:each 100 ml blood contain 19.4 ml O2). • Amount of oxygen released from the hemoglobin to the tissues is 5ml O2 per each 100ml blood. So O2 content in venous blood =19.4-5= 14.4 ml. • During strenuous exercise the oxygen uptake by the tissue increases 3 folds so 15 ml O2 is given /100 ml blood So O2 content in venous blood =19.4-15=4.4 ml O2 /100ml blood. At rest tissues consume 250 ml O2 /min and produce 200ml CO2
The oxygen-haemoglobindissociation curve • It shows the progressive increase in the percentage saturation of the Hb with the increase in the PO2 in the blood. • The PO2 in the arterial blood is about 95mmHg and saturation of Hb with O2 is about 97%. • In the venous blood returning from the tissues, the PO2 is about 40mmHg and the saturation of Hb with O2 is about 75%.
Factors shifting oxygen-haemoglobindissociation curve to the right
Factors affecting the affinity of Hb for O2 • 4 important factors • The pH or (H+ conc), • the temperature, • and the concentration of 2,3 diphosphoglycerate (2,3-DPG). • PCO2 concentration (Bohr effect) all shift the curve to the right. • P50: it is the partial pressure of O2 at which 50% of Hb is saturated with O2. • P50 means right shift lower affinity for O2. • P50 means left shift higher affinity for O2.
The Rt and Lt shifts: Definition: • Rtshift means the oxygen is unloaded to the tissues from Hb • Lt shift means loading or attachment of oxygen to Hb. • Increased 2,3DPG, H+, Temperature , PCO2 shift the curve to right. • 2,3DPG is synthesized in RBCs from the glycolytic pathway , it binds tightly to reduced Hb. increased 2,3 DPG facilitate the oxygen release and shifts the dissociation curve to Rt. • 2,3 DPG increases in the RBCs in anemia and hypoxemia, and thus serves as an important adaptive response in maintaining tissue oxygenation • Fetal Hb: has a P50 of 20 mmHg in comparison to 27 mmHg of adult Hb.
The Rt and Lt shifts: • Effect of carbon dioxide and hydrogen ions on the curve ( Bohr effect) • At lung: • Movement of CO2 from blood to alveoli will decrease blood CO2 &H+ →shift the curve to left and • Increase O2 affinity of Hb allowing more O2 transport to tissues • At tissues: • Increase CO2 &H+ in blood leads to →shift the curve to right and • Decrease O2 affinity of Hb allowing more O2 transport to tissues
Shift of dissociation curve during exercise • Exercise increases Temp, H+, 2,3 DPG and shift the curve to Rt. • Utilization Coefficient :The percentage of the blood that gives up its oxygen as it passes through the tissues capillaries is called utilization coefficient. Utilization Coefficient = O2 delivered to the tissues O2 content of arterial blood • Normally at rest = 5ml/20 ml= 25% , • During exercise it = 15 ml/20 ml= 75 % - 85%
Transport of oxygen in the dissolved state. • Only 3% of O2 is transported in the dissolved state, • At normal arterial PO2 of 95 mmHg , about 0.29 ml of oxygen is dissolved in each 100ml of blood. • When the PO2 of the blood falls to 40 mmHg in tissue capillaries, only 0.12 of oxygen remains dissolved. • Therfore 0.17 ml of oxygen is normally transported in the dissolved state to the tissues per each 100 ml of blood
Combination of Hb with CO ----- displacement of oxygen • CO combines with Hb at the same point on the Hb molecule as does oxygen, • It binds with Hb about 250 times as much as O2 (affinity of Hb to CO is very high (250 times) that to O2.It causes Lt shift of the O2-Hb curve.
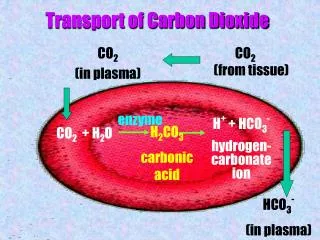
Transport of carbon dioxide in the blood • Carbon dioxide is transported in three forms: • Dissolved CO2 7% • Bicarbonate ions 70 % • Carbaminohemoglobin ( with Hb) 23%. • Each 100 ml of blood carry 4 ml of CO2 from the tissues.
Formation of HCO3_ & Chloride shift • In Tissues • In Pulmonary capillaries
The Haldane effect • When oxygen binds with hemoglobin , carbon dioxide is released- to increase CO2 transport • Binding of Hb with O2 at the lung causes the Hb to become a stronger acid and , this in turn displaces CO2 from the blood and into the alveoli • Change in blood acidity during CO2 transport. • Arterial blood has a PH of 7.41 that of venous blood with higher PCO2 falls to 7.37 ( i.e change of 0.04 unit takes place)
Respiratory Exchange ratio ( Respiratory Quotient) • Normally it is 4/5= 82% • When Carbohydrate diet is used R = 1 • When fats only is used R=0.7 • A person on normal diet R=0.825