Ancient Ice
Ancient Ice. Sean D. Pitman, M.D. January 2006. www.DetectingDesign.com. Layers of snow (firn) turn into layers of ice Layers thought to be laid down in an annual pattern In areas like Greenland and Antarctica there are hundreds of thousands of “annual layers”.

Ancient Ice
E N D
Presentation Transcript
Ancient Ice Sean D. Pitman, M.D. January 2006 www.DetectingDesign.com
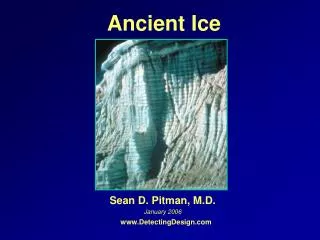
Layers of snow (firn) turn into layers of ice • Layers thought to be laid down in an annual pattern • In areas like Greenland and Antarctica there are hundreds of thousands of “annual layers”
Each layer of snow and then ice is compacted over time • 30cm of snowy firn turns into 10cm of ice • The layers of ice get thinner until they are visually indistinguishable
Antarctica - 5cm of water eq/yr (a “cold desert”) • Greenland - 50cm of water eq/yr • Obviously Greenland has thicker layers • Easier to see visually lower down • More accurate dates - though not as old as the Antarctic ice • Still upwards of 160,000 years old • American Greenland Ice Sheet Project (GISP2) • European Greenland Ice Core Project (GRIP)
Annual vs. Subannual layers? • Various large snowstorms and/or snowdrifts can lay down multiple layers in a given year
The Lost Squadron • Bob Cardin and other members of his squadron had to ditch their six P-38’s and two B-17’s when they ran out of gas in 1942 - 17 miles off the east coast of Greenland • In 1988 the planes were finally discovered under 260 feet (80m) of ice • 17 feet (~5m) of compacted snow/yr • One P-38 recovered (“Glacier Girl”)
In a telephone interview, Bob Cardin was asked how many layers of ice were above the recovered airplane. He responded by saying, “Oh, there were many hundreds of layers of ice above the airplane.” When told that each layer was supposed to represent one year of time, Bob said, “That is impossible! Each of those layers is a different warm spell – warm, cold, warm, cold, warm, cold.” http://groups.google.com/group/nz.soc.religion/msg/c14b9ca571d0c817?hl=en&lr=&ie=UTF-8&oe=UTF-8&safe=off
This example of buried airplanes does not reflect the actual climate of central Greenland or of central Antarctica • As a coastal region, this region is exposed to a great deal more storms and other sub-annual events that produce the 17 feet of annual snow per year. • However, even now, large snowstorms also drift over central Greenland. And, in the fairly recent warm Hypsithermal period (~4 degrees warmer than today) the precipitation over central Greenland, and even Antarctica, was most likely much greater than it is today. • So, how do scientists distinguish between annual layers and sub-annual layers?
“Fundamentally, in counting any annual marker, we must ask whether it is absolutely unequivocal, or whether non-annual events could mimic or obscure a year. For the visible strata (and, we believe, for any other annual indicator at accumulation rates representative of central Greenland), it is almost certain that variability exists at the subseasonal or storm level, at the annual level, and for various longer periodicities (2-year, sunspot, etc.). We certainly must entertain the possibility of misidentifying the deposit of a large storm or a snow dune as an entire year or missing a weak indication of a summer and thus picking a 2-year interval as 1 year.” Alley, R.B. et al., Visual-stratigraphic dating of the GISP2 ice core: Basis, reproducibility, and application. Journal of Geophysical Research 102(C12):26,367–26,381, 1997.
Distinguishing Between Annual and Subannual layers • Oxygen and other Isotopes • More 18O, relative to 16O, in summer than in winter due to increased energy required for evaporation
The Isotope Movement Problem • Every year the snow melts and liquid water percolates through the snowy firn dragging isotopes and other impurities with it – for hundreds and even thousands of years before the snow turns to ice • Gravitational forces alone influences molecular diffusion at different rates depending upon the differences in ion density • One of the evidences given for the reality of this phenomenon is the significant oxygen isotope enrichment (verses present day atmospheric oxygen ratios) found in 2,000 year-old-ice from Camp Century, Greenland. • Lorius et al., in a 1985 Nature article: • “Further detailed isotope studies showed that seasonal delta 18O variations are rapidly smoothed by diffusion indicating that reliable dating cannot be obtained from isotope stratigraphy” Craig H., Horibe Y., Sowers T., “Gravitational Separation of Gases and Isotopes in Polar Ice Caps”, Science, 242(4885), 1675-1678, Dec. 23, 1988.
“The accumulating firn [ice-snow granules] acts like a giant columnar sieve through which the gravitational enrichment can be maintained by molecular diffusion. At a given borehole, the time between the fresh fall of new snow and its conversion to nascent ice is roughly the height of the firn layers in [meters] divided by the annual accumulation of new ice in meters per year. This results in conversion times of centuries for firn layers just inside the Arctic and Antarctic circles, and millennia for those well inside [the] same. Which is to say--during these long spans of time, a continuing gas-filtering process is going on, eliminating any possibility of using the presence of such gases to count annual layers over thousands of years.” Hall, Fred. “Ice Cores Not That Simple”, AEON II: 1, 1989:199
Volcanic Signatures • Tephra and H2SO4 • Electrical conductivity measurements (ECM) increase
Volcanic Signature Problems • Tephra not often found because it falls out of the atmosphere before it makes it to the ice sheet • Below 10,000 layers the ice becomes too alkaline to reliably identify the acid spikes associated with volcanic eruptions • Volcanic eruption rates: 30 per year on average – The farther back in history, the fewer of even large volcanic eruptions are known • Only 11 eruptions were recorded from between 1 and 100 AD
“The desire to link such phenomena [volcanic eruptions] and the stretching of the dating frameworks involved is an attractive but questionable practice. All such attempts to link (and hence infer associations between) historic eruptions and environmental phenomena and human "impacts", rely on the accurate and precise association in time of the two events. . . A more general investigation of eruption chronologies constructed since 1970 suggest that such associations are frequently unreliable when based on eruption data gathered earlier than the twentieth century.” - Baille 1991, University of Wales (http://www.aber.ac.uk/iges/cti-g/volcano/lecture2.html)
Mt. Mazama, C14, and Ice Cores • Crater Lake in Oregon was once a much larger mountain (Mt. Mazama) before it blew up as a volcano • 1960s: Eruption radiocarbon dated at 6,500 yrs • 1979: 9,000 yrs via sagebrush bark sandals • 2000: 6,400 yrs via “direct count of ice core layers • 2003: 5,600 yrs at 16th INQUA conference (attended by over 1,000 scientists) via Radiocarbon Kevin M. Scott http://inqua2003.dri.edu/inqua03_abstracts_p160-183.pdf
Thera, Tree Rings, and Ice Cores • The Mediterranean volcano Thera, was so large that it effectively destroyed the Minoan (Santorini) civilization in the year 1628 B.C. • Tree rings from that region show a significant disruption matching that date. • Layers in the "Dye 3" Greenland ice core showed such a major eruption in 1645, plus or minus 20 years. • This match was used to confirm or calibrate the ice core data as recently as 2003
Thera Calibration Problems • At the time of the initial study scientists did not have the budget to do a systematic search throughout the whole ice core for such large anomalies that might also match a Thera-sized eruption • Now that such detailed searches have been done, many such sulfuric acid peaks have been found at numerous dates within the 18th, 17th, 16th, 15th, and 14th centuries B.C. • Beyond this, tephra analyzed from the "1620s" ice core layers did not match the volcanic material from the Thera volcano. Zielinski et al., "Record of Volcanism Since 7000 B.C. from the GISP2 Greenland Ice Core and Implications for the Volcano-Climate System",Science Vol. 264 pp. 948-951, 13 May 1994
Four years later the investigators concluded: "Although we cannot completely rule out the possibility that two nearly coincident eruptions, including the Santorini eruption, are responsible for the 1623 BC signal in the GISP ice core, these results very much suggest that the Santorini eruption is not responsible for this signal. We believe that another eruption led not only to the 1623 BC ice core signal but also, by correlation, to the tree-ring signals at 1628/1627 BC." Zielinski and Germani, "New Ice-Core Evidence Challenges the 1620s BC Age for the Santorini (Minoan) Eruption", Journal of Archaeological Science 25(1998), pp. 279-289
So, here we have a clearly erroneous match between a volcanic eruption and both tree rings and ice core signals • Yet, many scientists still declare that ice cores are solidly confirmed by such means? • Beyond this, as flexible as the dating here seems to be, the Mt. Mazama and Thera eruptions are still about the oldest eruptions that can be even theoretically identified in the Greenland ice cores • Below 10,000 layers or so the ice becomes too alkaline to reliably identify the acid spikes associated with volcanic eruptions. • The great majority of volcanic eruptions throughout history were not able to get very much tephra into the Greenland ice sheet.
Cyclic Dust Deposits • Thought to be one of the most reliable annual markers since it is more dusty in the summer than in the winter • Dust is alkaline and shows up as a low Electrical Conductivity Measurement (ECM) reading • The number of dust layers = years
Real time studies of modern atmospheric dust deposition in the 1990’s on the Penny Ice Cap, Baffin Island, Arctic Canada show that chloride, nitrate, methane-sulphonic acid (MSA) and H2O2 are “greatly affected” by post-depositional effects • Mainly re-emission in the atmosphere in upper layers and the movement of acid species in the deep ice layers • SO4, NO3, NH4 and Mg++ are the most mobile ions while Cl - and Na+ are the most stable Zdanowicz CM, Zielinski GA, Wake CP, “Characteristics of modern atmospheric dust deposition in snow on the Penny Ice Cap, Baffin Island, Arctic Canada”, Climate Change Research Center, Institute for the Study of Earth, Oceans and Space, University of New Hampshire, Tellus, 50B, 506-520, 1998.
Yearly dust cycle marked by two fall/spring peaks instead of one yearly peak as previous thought • Evidence that “microparticles are remobilized by meltwater in such a way that seasonal (and stratigraphic) differences are obscured” • This remobilization of the microparticles of dust in the snow was found to affect both fine and coarse particles in an uneven way. The resulting “dust profiles” displayed “considerable structure and variability with multiple well-defined peaks” for any given yearly deposit of snow. • Correlates very well with ice layers formed by warm melts • Ice layers create a physical barrier (can be many per year) • Problems limit the resolution of this method to “multiannual to decadal averages” • Note: 100 x more dust during last “ice age” - with increased precipitation?
“While some dust peaks are found to be associated with ice layers or Na [sodium] enhancements, others are not. Similarly, variations of the NMD [number mean diameter – a parameter for quantifying relative changes in particle size] and beta cannot be systematically correlated to stratigraphic features of the snowpack. This lack of consistency indicates that microparticles are remobilized by meltwater in such a way that seasonal (and stratigraphic) differences are obscured… We failed to identify any consistent relationship between dust concentration or size distribution, and ionic chemistry or snowpack stratigraphy. . . [These problems limit the resolution of this method to] “multiannual to decadal averages” Zdanowicz CM, Zielinski GA, Wake CP, “Characteristics of modern atmospheric dust deposition in snow on the Penny Ice Cap, Baffin Island, Arctic Canada”, Climate Change Research Center, Institute for the Study of Earth, Oceans and Space, University of New Hampshire, Tellus, 50B, 506-520, 1998.
The Appearance of Annual Layers • The resulting “dust profiles” display “considerable structure and variability with multiple well-defined peaks” for any given yearly deposit of snow. The authors hypothesized that this variability was most likely caused by a combination of factors to include “variations of snow accumulation or summer melt and numerous ice layers acting as physical obstacles against particle migration in the snow.”
More recent articles (Nature, May 2001): • “Chemicals trapped in ancient glacial or polar ice can move substantial distances within the ice (up to 50cm in deep ice). That means past analyses of historic climate changes gleaned from ice core samples might not be entirely accurate.” “The point of the paper is to suggest that the ice core community go back and redo the chemistry.”
The Warm Age • Hypsithermal (Middle Holocene) Age • A warm period from 9,000 to 4,000 years ago • ~5 degrees warmer than today (Fahrenheit) • 1°F increase in average global temperature = 7 °F increase in average arctic basin temperature with a 17°F increase in the average December temperature • Without the Arctic ice cap, winters in Canada and Siberia would rise 20 to 50 °F while over the Arctic Ocean temperatures would rise 35 to 70 °F M. Warshaw and R. R. Rapp, "An Experiment on the Sensitivity of a Global Circulation Model," Journal of Applied Meteorology 12 (1973): 43-49.
Borisov, a long time meteorology and climatology professor at Leningrad State University makes the following observation: “During the last 18,000 years, the warming was particularly appreciable during the Middle Holocene. . . The most perturbing questions of the stage under consideration are: Was the Arctic Basin iceless during the culmination of the optimum? . . . i.e., when the first pyramids were already being built in Egypt?” Borisov P., Can Man Change the Climate?, trans. V. Levinson (Moscow, U. S. S. R.), 1973
Ice Sheets in Warm Age? • Evidence of a Green Greenland? • Remains of warm water mollusks are found above the article circle that are 750 miles farther south today • Mediterranean vertebrates found • Large trees • Fruit trees and other fruiting plants • Peat – requiring warmer climate above 32°F ave., adequate drainage, and 40in of rainfall/year • Pine needs and other organic debris from ice core drilling
Dorthe Dahl-Jensen, a professor at the University of Copenhagen's Niels Bohr Institute and NGRIP project leader noted that the such plant material found under about 10,400 feet of ice indicates the Greenland Ice Sheet "formed very fast."
The well preserved "mummified" remains of millions of mammoths have been found along with those of many other types of warmer weather animals such as the horse, lion, tiger, leopard, bear, antelope, camel, reindeer, giant beaver, musk sheep, musk ox, donkey, ibex, badger, fox, wolverine, voles, squirrels, bison, rabbit and lynx as well as a host of temperate plants. These are still being found all jumbled together within the Artic Circle - along the same latitudes as Greenland all around the globe!
When did these Creatures live? • According to scientists mammoths were still living in these regions within the past 10,000 to 20,000 years! • Carbon 14 dating of Siberian mammoths has returned dates as early as 9670± 40 years before present (BP) • So, why is this a problem? Mol, Y. Coppens, A.N. Tikhonov, L.D. Agenbroad, R.D.E. Macphee, C. Flemming, A. Greenwood, B Buigues, C. De Marliave, B. van Geel, G.B.A. van Reenen, J.P. Pals, D.C. Fisher, D. Fox, "The Jarkov Mammoth: 20,000-Year-Old carcass of Siberian woolly mammoth Mammuthus Primigenius" (Blumenbach, 1799), The World of Elephants - International Congress, Rome 2001
Wasn’t it very cold where Mammoths lived? • Contrary to popular imagination, these creatures were not surrounded by the extremely cold, harsh environments that exist in these northerly regions today • Rather, they lived in rather lush steppe-type conditions to include evidence of large fruit bearing trees, abundant grasslands, and the very large numbers and types of grazing animals already mentioned only to be quickly and collectively annihilated over huge areas by rapid weather changes. • Clearly, the present is far far different than even the relatively recent past must have been.
Zazula et. al. published the June 2003 issue of Nature: "This vegetation [Beringia: Includes an area between Siberia and Alaska as well as the Yukon Territory of Canada] was unlike that found in modern Arctic tundra, which can sustain relatively few mammals, but was instead a productive ecosystem of dry grassland that resembled extant subarctic steppe communities . . . [such conditions] are indicative of diverse forbs growing on dry, open, disturbed ground, possibly among predominantly arid steppe vegetation. Such an assemblage has no modern analogue in Arctic tundra. Local habitat diversity is indicated by sedge and moss peat from deposits that were formed in low-lying wet areas . . .[This region] must have been covered with vegetation even during the coldest part of the most recent ice age (some 24,000 years ago) because it supported large populations of woolly mammoth, horses, bison and other mammals during a time of extensive Northern Hemisphere glaciation."
Most of Artic Warm, Greenland Cold? • Does it really make sense for this subartic region to be so warm, all year round, while the same latitudes on other parts of the globe where covered with extensive glaciers? • Siberia, Alaska, Northern Europe and parts of northwestern Canada were all toasty warm, sustaining many mammoths and other large mammals, while much of the remaining North American Continent and Greenland were covered with huge glaciers? Really? • How was the Greenland ice sheet able to be so resistant to the temperate climate surrounding it on all sides for hundreds much less thousands of years?
There has been a 1°F increase in ave. global temperature over 100yrs: • Glacier National Park has gone from 150 glaciers to just 35 today • Many of the glaciers that remain have lost over 90% of their volume • The speed of glacial demise is only recently being appreciated by scientists who are “stunned” now that they realize that glaciers around the world, like those of Mt. Kilimanjaro, the Himalayas just beneath Mt. Everest, the high Andes, Swiss Alps and even Iceland, will be completely gone within just 30 years – at current rates
Initial research done by Carl Boggild of the Geological Survey of Denmark and Greenland (GEUS), involving data from a network of 10 automatic monitoring stations, showed that the large portions of the Greenland ice sheet are melting up to 10 times faster than earlier research had indicated.
In 2000, research indicated that the Greenland ice was melting at a conservative estimate of just over 50 cubic kilometers of ice per year. Greenland covers 840,000 square miles with about 85% of that area covered by ice up to 2 miles thick. With an exponentially increasing melt rates, Greenland will be green within a surprisingly, even shockingly, short period of time if the melt continues like it has – in less than 100 years. Local towns are beginning to sink because of the melting permafrost. Even potatoes are starting to grow in Greenland!
In April of 2000, Lars Smedsrud and Tore Furevik wrote in an article in the Cicerone magazine, published by the Norwegian Climate Research Centre (CICERO): “If the melting of the ice, both in thickness and surface area, does not slow, then it is an established fact that the arctic ice will disappear during this century. This is based on the fact that the Arctic ice has thinned by some 40% between the years 1980 and 2000.”
Alaska's glaciers are receding at twice the rate previously thought, according to a new study published in July 19, 2002 Science journal. • Prof. Thompson reported to AAAS that at least one-third of the massive ice field on top of Tanzania's Mount Kilimanjaro has melted in only the past twelve years. Further, since the first mapping of the mountain's ice in 1912, the ice field has shrunk by 82%. By 2015, there will be no more "snows of Kilimanjaro."