Download

1 / 92
930 likes | 1.35k Views
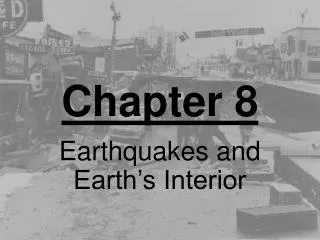
Chapter 10: Earthquakes and Earth’s Interior. Introduction. When the Earth quakes, the energy stored in elastically strained rocks is suddenly released. The more energy released, the stronger the quake. Massive bodies of rock slip along fault surfaces deep underground.

E N D
Introduction • When the Earth quakes, the energy stored in elastically strained rocks is suddenly released. • The more energy released, the stronger the quake. • Massive bodies of rock slip along fault surfaces deep underground. • Earthquakes are key indicators of plate motion.
How Earthquakes Are Studied (1) • Seismometers are used to record the shocks and vibrations caused by earthquakes. • All seismometers make use of inertia (慣性), which is the resistance of a stationary mass to sudden movement. • This is the principal used in inertial seismometers. • The seismometer measures the electric current needed to make the mass and ground move together.
How Earthquakes Are Studied (2) • Three inertial seismometers are commonly used in one instrument housing to measure up-down, east-west, north-south motions simultaneously.
↑ → ← ↓ Figure 10.2
Earthquake Focus And Epicenter • The earthquake focus (震源) is the point where earthquake starts to release the elastic strain of surrounding rock. • The epicenter (震央) is the point on Earth’s surface that lies vertically above the focus of an earthquake. • Fault slippage begins at the focus and spreads across a fault surface in a rupture front. • The rupture front travels at roughly 3 kilometers per second for earthquakes in the crust.
The First Seismogram from a Distant Earthquake Seismology (地震學) is a fairly young science; recordings of earth motion (seismograms) have only been made for about 100 years. Shown is what is widely considered to be the first remote (teleseismic) seismogram, made on April 17, 1889, in Potsdam, Germany by E. von Rebeur-Pacshwitz (Nature, 1889). The instrument was a photographically recording horizontal pendulum originally installed for astronomical purposes. The earthquake was in Japan and had a magnitude of about 5.8. Source: http://www.iris.edu
Epicenter Focus Figure 10.3
Seismic Waves (1) • Vibrational waves spread outward initially from the focus of an earthquake, and continue to radiate from elsewhere on the fault as rupture proceeds.
Seismic Waves (2) • There are two basic families of seismic waves. • Body waves(體波)can transmit either: • Compressional motion (P waves), or • Shear motion (S waves). • Surface waves(表面波)are vibrations that are trapped near Earth’s surface. There are two types of surface waves: • Love waves, or • Rayleigh waves.
Body Waves (1) • Body waves travel outward in all directions from their point of origin. • The first kind of body waves, a compressional wave, deforms rocks largely by change of volume and consists of alternating pulses of contraction and expansion acting in the direction of wave travel. • Compressional waves are the first waves to be recorded by a seismometer, so they are called P (for “primary”) waves.
P-wave: Longitudinal wave (縱波) Figure 10.4 Dan Russel
Body Waves (2) • The second kind of body waves is a shear wave (剪力波). • Shear waves deform materials by change of shape, • Because shear waves are slower than P waves and reach a seismometer some time after P waves arrives, they are called S (for “secondary”) waves.
Figure 10.4 S-wave: Transverse wave (橫波) SV motions on the vertical plane parallel to the propagation direction Dan Russel
Body Waves (3) • Compressional (P) waves can pass through solids, liquid, or gases. • P waves move more rapidly than other seismic waves: • 6 km/s is typical for the crust. • 8 km/s is typical for the uppermost mantle.
Body Waves (4) • Shear (S) waves consist of an alternating series of side-wise movements. • Shear waves can travel only within solid matter. • The speed of a S wave is times that of a P wave. A typical speed for a S wave in the crust is 3.5 km/s, 5 km/s in the uppermost mantle. • Seismic body waves, like light waves and sound waves, can be reflected and refracted by change in material properties. • When change in material properties results in a change in wave speed, refraction bends the direction of wave travel.
Body Waves (5) • For seismic waves within Earth, the changes in wave speed and wave direction can be either gradual or abrupt, depending on changes in chemical composition, pressure, and mineralogy. • If Earth had a homogeneous composition and mineralogy, rock density and wave speed would increase steadily with depth as a result of increasing pressure (gradual refraction). • Measurements reveal that the seismic waves are refracted and reflected by several abrupt changes in wave speed.
c: reflection at the core-mantle boundary K: P wave in the outer core I: P wave in the inner core i: P wave reflection at the inner-outer core boundary Figure 10.6
Surface Waves (1) • Surface waves travel along the surface of the ground or just below it, and are slower than than body waves, but are often the largest vibrational signals in a seismogram. The two most important are Rayleigh and Love waves, named after British scientists, Lord Rayleigh and A.E.H. Love who discovered them
Surface Waves (2) • Rayleigh waves combine shear and compressional vibration types, and involve motion in both the vertical and horizontal directions. The velocity of Rayleigh waves is about 0.92 times that of S waves. • Love waves consist entirely of shear wave vibrations in the horizontal plane, analogous to an S wave that travels horizontally, so they only appear in the horizontal component of a seismogram. The velocity of Love waves is approximately equal to that of S waves, so they arrive earlier than Rayleigh wave.
Rayleigh wave – particle motions on the vertical plane parallel to the propagation direction Propagation direction Love wave – particle motions on the horizontal plane perpendicular to the propagation direction Propagation direction
Rayleigh wave retrograde (counter-clockwise) motions P > S > Rayleigh wave velocity
Surface Waves (2) • The longer the wave length of a surface wave, the deeper the wave motion penetrates Earth. Surface waves of different wave lengths develop different velocities. This Behavior is called Dispersion (色散).
Chi-Chi Earthquake: a shallow earthquake caused by the collision between the Eurasian and Philippine plate. Northridge Earthquake: a shallow earthquake occuring along a splay of the San Andreas fault system near San Fernado Valley, just north of Los Angeles. Izmit Turkey Earthquake: a shallow earthquake occuring along the E-W trend North Anatolian fault. Starting in 1939, the NA fault has produced a sequence of major earthquakes, of which the 1999 event is the 11th with a magnitude M≥ 6.7. Bolivia Earthquake: the deepest earthquake of this size (M=8.1, d=670 km) ever recorded, caused by the Cocos plate subducting under the south American continent. Source: http://www.iris.edu/pub/programs/sel/ibmpc/ Seislove and Seiswave
Determining The Epicenter (1) • An earthquake’s epicenter can be calculated from the arrival times of the P and S waves at a seismometer. • The farther a seismometer is away from an epicenter, the greatest the time difference between the arrival of the P and S waves.
Determining The Epicenter (2) • The epicenter can be determined when data from three or more seismometers are available. • It lies where the circles intersect (radius = calculated distance to the epicenter). • The depth of an earthquake focus below an epicenter can also be determined, using P-S time intervals.
Figure 10.9 Figure 10.8
Earthquake Magnitude (1) • In 1935, Charles Richter at Caltech devised a calibration scheme, called Richter scale, for describing the size of an earthquake. • The Richter magnitude (芮氏地震規模) is based on a logarithmic scaling of energy released by earthquakes and divided into steps called magnitudes with numerical values M from 0 to 10. • A large-sized earthquake occurs over a larger fault, requires more time to rupture, and therefore generate longer-period seismic waves. Thus, the energy released by an earthquake affects both the amplitude X and the oscillation period T of the P wave.
Earthquake Magnitude (2) • Richter’s original magnitude formula depends on the logarithm of the ratio X/T. One unit of Richter magnitude corresponds to a tenfold increase in X/T as measured by a seismometer. A correction factor is added to adjust the different distance between the earthquake and seismometer. • Later seismologists devised more general magnitude estimate based on either on P wave (T~1 s), called mb, surface wave trapped in the crust (T~20 s), or surface trapped in the upper mantle (T~200 s), called Ms.
Earthquake Magnitude (3) • Lately, earthquake magnitude has been connected more directly to motions on a fault. In 1977, Hiroo Kanamori at Caltech proposed a relation between Richter magnitude M and seismic moment M0. The moment is directly related to the mechanical energy released by fault motion. The seismic moment is expressed as M0= μAD where μ (unit: newtons/m2) is shear stiffness of rock surrounding the fault, A (unit: m2) is the area of the fault, and D (unit: m) is the average slip during the earthquake. Seismic moment has the energy units of newton-m=joules. Kanamori’s relation between moment and magnitude is M = (2/3) log10 M0 - 6.0
Earthquake Magnitude (4) • Most crustal rocks have shear stiffness μ=3x10¹⁰ nt/m2. If an earthquake slips 3 km on a vertical fault 50 km long that extends from the surface to 15 km depth, what is the magnitude of this earthquake? M0 =(3x10¹⁰ nt/m2)(50,000m)(15,000m)(3m)=6.75x1019 joules M=(2/3)log10 M0 - 6.0=7.2 • Each step in the Richter scale, for instance, from magnitude M = 2 to magnitude M = 3, represents approximately a thirty fold (101.5=31.6) increase in seismic moment (or energy). • The largest earthquake in 20th century that occurred in 1960 in the subduction zone beneath Chile has a M=9.5, breaking along an 800-km-long fault. The average fault slip was estimated to be 25 m.
Earthquake Frequency (1) • Each year there are roughly 200 earthquakes worldwide with magnitude M = 6.0 or higher. • Each year on average, there are 20 earthquakes with M = 7.0 or larger. • Each year on average, there is one “great” earthquake with M = 8.0 or larger.
Earthquake Frequency (2) • Four earthquakes in the twentieth century met or exceeded magnitude 9.0. • 1952 in Kamchatka (M = 9.0). • 1957 in the Aleutian Island (M = 9.1). • 1964 in Alaska (M = 9.2). • 1960 in Chile (M = 9.5).
Earthquake Frequency (3) • The nuclear bomb dropped in 1945 on the Japanese city of Hiroshima was equal to an earthquake of magnitude M = 5.3. • The most destructive man-made devices are small in comparison with the largest earthquakes.
Earthquake Hazard • Seismic events are most common along plate boundaries. • Earthquakes associated with hot spot volcanism pose a hazard to Hawaii. • Earthquakes are common in much of the intermontane western United States (Nevada, Utah, and Idaho). • Several large earthquakes jolted central and eastern North America in the nineteenth century (New Madrid, Missouri, 1811 and 1812).
Figure 10.10 A seismic risk map based on maxium horizontal acceleration during an earthquake, expressed as the percentage of the acceleration due to gravity (9.8m/s2).
Earthquake Disasters (1) • In Western nations, urban areas that are known to be earthquake-prone have special building codes that require structures to resist earthquake damage. • However, building codes are absent or ignored in many developing nations. • In the 1976 T’ang Shan earthquake in China, 240,000 people lost their lives.
Earthquake Disasters (2) • Eighteen earthquakes are known to have caused 50,000 or more deaths apiece. • The most disastrous earthquake on record occurred in 1556, in Shaanxi province, China, where in estimated 830,000 people died.
Earthquake Damage (1) • Earthquakes have six kinds of destructive effects. • Primary effects: • Ground motion results from the movement of seismic waves. • Where a fault breaks the ground surface itself, buildings can be split or roads disrupted.
Earthquake Damage (2) • Secondary effects: • Ground movement displaces stoves, breaks gas lines, and loosens electrical wires, thereby starting fires. • In regions of steep slopes, earthquake vibrations may cause regolith (表土) to slip and cliffs to collapse. • The sudden shaking and disturbance of water-saturated sediment and regolith can turn seemingly solid ground to a liquid mass similar to quicksand (流沙) (liquefaction,液化). • Earthquakes generate seismic sea waves, called tsunami (海嘯), which have been particularly destructive in the Pacific Ocean.
Modified Mercalli Scale (修正麥卡利震度階級 ﹐簡稱為MM震度階級) • This scale is based on the amount of vibration people feel during low-magnitude quakes, and the extent of building damage during high-magnitude quakes. • There are 12 degrees of intensity in the modified Mercalli scale (see Table 10.2)
World Distribution of Earthquakes • Subduction zones have the largest quakes. • The circum-Pacific belt, where about 80 percent of all recorded earthquakes originate, follows the subduction zones of the Pacific Ocean. • The Mediterranean-Himalayan belt is responsible for 15 percent of all earthquakes.